Methodology
To study social cohesion of Ukrainian society, a nationwide survey was taken among Ukrainian people staying in Ukraine (N = 2,050) and Ukrainians who left abroad after the outbreak of Russia’s full — scale invasion into Ukraine and have been permanently residing in the EU MS (N = 411).
For the purposes of this study, we define a concept of social cohesion as the capacity of a society to ensure the welfare of all its members while minimizing disparities and avoiding polarization, as well as building supportive communities of free individuals pursuing their goals by democratic means (Hulse, Kath & Stone, Wendy (2007). Guided by the approach suggested by Schiefer & van der Noll (2016), we determined 4 analytical dimensions of social and political life: economic, social, political, and media — related. In each dimension, we tested the presence of objective (tangible) barriers impeding individuals in the exercise of their right and willingness to participate in public life, and the subjective barriers that demotivate such participation and/or decrease the feeling of agency of individuals.
Survey in Ukraine
The survey was conducted from 01.04.2025 to 05.04.2025.
The survey was run by Rating Online LLC. The target audience was adult population of Ukraine above 18. The survey was conducted on all territories of Ukraine, except for the temporarily occupied territories and the territories that did not have any Internet and mobile connection coverage at the moment of running the sruvey.
Survey method: CATI — CAWI (Computer Assisted Telephone Interview, Computer Assisted Web Interview) — a random sampling of respondents by telephone numbers with their further invitation to fill in an online questionnaire.
Sample size:
Adult population of Ukraine above 18 residing on the territory of Ukraine, except for the temporarily occupied territories and the territories that did not have any Internet and mobile connection coverage at the moment of running the sruvey. n = 2050.
|
Status (among those answering the call) |
UA OPORA 01 — 03.04.25 |
|
Refused: |
44540 |
|
During the interview |
2693 |
|
Before the start of the interview |
41847 |
|
Technical issues |
3135 |
|
Are not included in the quota |
3720 |
|
Successful interview |
7237 |
|
Total number of respondents answering the call |
58632 |
|
Response rate: % |
14.0 |
|
Duration |
00:02:46 |
|
Total number of outgoing calls |
449594 |
|
Agents |
106 |
The questionnaire was available in two languages, up to respondent’s choice. Respondents could refuse from participation in the questionnaire and interrupt at any point. If respondents interrupted their participation in an online questionnaire but resumed it later, they continued filling the questionnaire from where they stopped.
Among the 7,237 respondents agreeing to take the online questionnaire, 2,050 respondents completed it. Response rate (online) = 28.3%
Average duration of recruiting stage (CATI): 00:02:46
Average interview duration (CAWI): 00:27:43
Find below the comparison of social demographic structure of the survey sample, with the structure of all respondents agreeing to participate:
|
Characteristics |
Alternatives |
Survey sample, % |
|
GENDER |
Male |
45.2 |
|
Female |
54.8 |
|
|
AGE |
18 — 29 |
15.2 |
|
30 — 39 |
21.7 |
|
|
40 — 49 |
17.3 |
|
|
50 — 59 |
22.0 |
|
|
60+ |
23.9 |
|
|
OBLAST OF RESIDENCE |
Vinnytsia |
4.6 |
|
Volyn |
2.9 |
|
|
Dnipropetrovsk |
9.6 |
|
|
Donetsk |
1.2 |
|
|
Zhytomyr |
3.1 |
|
|
Zakarpattia |
3.3 |
|
|
Zaporizhzhia |
4.0 |
|
|
Ivano — Frankivsk |
4.4 |
|
|
Kyiv |
5.5 |
|
|
Kirovohrad |
2.8 |
|
|
Lviv |
7.2 |
|
|
Mykolaiv |
3.2 |
|
|
Odesa |
6.7 |
|
|
Poltava |
4.2 |
|
|
Rivne |
2.8 |
|
|
Sumy |
3.1 |
|
|
Ternopil |
2.7 |
|
|
Kharkiv |
6.2 |
|
|
Kherson |
1.4 |
|
|
Kmelnytskyi |
3.3 |
|
|
Cherkasy |
3.9 |
|
|
Chernivtsi |
2.5 |
|
|
Chernihiv |
2.9 |
|
|
Kyiv city |
8.5 |
|
|
SETTLEMENT TYPE |
Oblast center |
42.3 |
|
Other city in the Oblast |
26.4 |
|
|
Village |
31.3 |
Survey Among Ukrainian People in the EU
Audience: Ukrainian people, aged 18 and above, who found their temporary protection in European countries after 24.02.2022. The results are weighted using current data of UNHC (United Nations High Commissioner for Refugees, the number of Ukrainians who applied for protection, TP or other similar national protection programs).
Period of data collection: April 5 — 7, 2025.
Survey method: CAWI (Computer — Assisted Web Interview) — online survey via messengers and social media.
TA sample size: 411 respondents
To achieve random selection and maximum coverage, 249,878 contact attempts were made, reaching 5,312 respondents. Among them:
|
Everyone reached |
5,312 |
|
Opened but have not started or have not comleted |
4,740 |
|
Completed (all Ukrainians in Europe) |
572 |
|
Completed, TA (moved to Europe after 24.02.2022) |
411 |
|
Response rate (all Ukrainians in Europe) |
10.8% |
|
Response rate of TA (moved to Europe after 24.02.2022) |
7.7% |
Average interview duration (CAWI): 00:24:32
Find below the percentage distribution of key social and demographic characteristics of the sample:
|
Characteristics |
Alternatives |
Share, % |
|
GENDER |
Male |
26.6 |
|
Female |
73.4 |
|
|
AGE |
18 — 34 |
40.9 |
|
35 — 64 |
51.3 |
|
|
65+ |
7.8 |
Key Conclusions
Although the full — scale Russian invasion caused a huge outburst of unity based on shared experiences and surviving the existential threat, i.e. mechanical solidarity, the emergency consolidation is situational and cannot last long. Long — sterm stability and the development of society depend on the building of organic solidarity, the one that is based on strong social connections, the feeling of belonging to a broader political community and the focus on the common good, even with social and cultural diversity.
The survey findings illustrate the uneven situation. As of present, the degree of social cohesion is moderate and stable, enhanced by a shared identity and solidarity on a horizontal level in the settings of existential threat. It can be confirmed by the prevailing pride of being a Ukrainian, strong attachment to the nation, and a hgh level of mutual help. This cohesion on the grass root level is an important buffer against the fragmentation of society in wartime.
At the same time, the trust on all levels, including the social level, is fragmented: mainly, most respondents rather do not trust or trust less each other, the media they read, and authorities. Social participation, or mutual support on a horizontal level, and the feeling of attachment to their community do not transform into any civil participation, despite the high interest in politics. Large scale economic vulnerability and difficulties with providing for basic needs, low economic potential, and a widespread relative deprivation, or the feeling that a person failed to receive the goods they deserve or that rightfully belong to them, in combination with the low political agency and the feeling of invisibility for the media bring structural risks for long — term organic solidarity in society. When the physical threat decreases or disappears, these factors may generate the overall disillusionment and alienation from social life, which may create favourable conditions for growing populist or extremist political parties.
The solution to these problems through the establishment of reliable systems of economic security, support to inclusive governance, and the making of an independent, representative, and transparent media environment will be critical for the transition from the wartime unity to a deeply integrated, resilient, and fair post — war society.
Economic level: prevailing vulnerability and disparity
- Economic vulnerability as a threat to cohesion. Less than a half of respondents in Ukraine (48.4%) and slightly over a half of Ukrainians abroad (55.7%) have paid jobs. In addition, they have a higher educational background, especially respondents out of the country (76.2%). It indicates difficulties in realizing professional potential. This situation points to deep economic vulnerability, which in the medium and long term could weaken social ties, reduce trust, and reinforce divisions in society.
- Low financial resilience. Every third respondent in Ukraine (29.3%) will not be able to cover their basic needs in case they lose a source of income. Other 17.6% will be able to last as short as one month. even for Ukrainian people abroad, the situation is still vulnerable. This level of instability disables long — term planning and increases the risks of social alienation, especially in the wartime and with no stable institutional support.
- Gender disparity in economic vulnerability. Women are half as likely to be able to support themselves if they lose their income (5.9% vs 11.3% of men), and 35.4% will not be able to meet their basic needs, compared with 22% of men. Women also find it more difficult to make ends meet (59.8% compared to 44% of men) and pay bills at the end of the month (57.2% and 43.2% respectively).
- More complicated experience for vulnerable groups: People with disabilities have an extremely low employment levels (25.1%) and higher incapacity to provide for their basic needs in case they lose their source of income (42.4%). Internally displaced persons (IDPs) also have lower employment levels (40.9% vs 49.5% for people other than IDPs) and more dependance on humanitarian and social assistance (23.1% ve 31.3% accordingly, compared with 6.7% and 11.4% for non — IDPs).
- Widespread material deprivation. Last year, every fifth Ukrainian (19.4%) experienced loosing cash income. 10.1% were not receiving the necessary medication or medical care (15% abroad), 6.5% in Ukraine and 14.4% abroad did not have any permanent housing. The data shows the existence of especially vulnerable groups who would never achieve social participation and stability without a dedicated government support.
- Instability in housing conditions. Although 63.5% of respondents in Ukraine live in the housing they own, 14.4% do not have any long — term certainty about their housing conditions. Among the IDPs, as few as 18.2% are house owners, and almost a quarter (24.0%) run the risk of losing their current housing within six months.
- Low economic potential and moderate relative deprivation. More than half of Ukrainians (52.6%) admit that they find it difficult to make ends meet. At the same time, most respondents do not feel restricted in their access to education, housing, or employment, even despite the difficult conditions. This indicates a moderate level of relative deprivation: resources are limited, but feelings of injustice do not dominate.
Social Dimension: Fragmented Trust, Strong Idenity, and High Engagement
- Low trust levels build a barrier to cohesion. Despite high social mobilization, overall interpersonal trust remains low: only 21% of respondents in Ukraine and 18% abroad trust the majority. Most believe that people should not be trusted but rather treated cautiously. This undermines horizontal cohesion and reduces the willingness to help one another, which is particularly important in times of crisis.
- Despite a general lack of trust, most respondents demonstrate a strong sense of self — worth and ability to influence events around them. The average value of the social inclusion index (ESIS) is 7.4 out of 10, indicating a moderately high level of subjective sense of inclusion at the local community level.
- Most respondents feel included in society: 80.6% in Ukraine and 77.1% abroad say that others trust them. Most also believe that they can influence their environment (82% in Ukraine, 86.1% abroad) and their own lives (76.1% and 79.5%, respectively). Ukrainians abroad are more likely to believe in their impact on their environment, which may indicate greater confidence or better adaptation.
- However, the sense of mutual assistance is uneven. Only about half of respondents in Ukraine (56.4%) believe that they receive help when they really need it, compared to 67.4% abroad, indicating potential gaps in the perception of social support networks.
- The feeling of “being needed by one's community/Ukraine” is strong in Ukraine (67.9%), but significantly lower abroad (46.1% in Ukraine, 48.1% in another country of residence). This highlights the integration challenges faced by refugees.
- Internally displaced persons report lower levels of control over their lives (67.4% compared to 77.5% among non — internally displaced persons).
- Solidarity and collective identity. Respondents demonstrate a high level of solidarity and national pride: more than two — thirds (75% in Ukraine and 70.9% abroad) believe that Ukrainians have a lot in common and that they are personally proud to be citizens of Ukraine (83.9% in Ukraine, 77.9% abroad). A national identity prevails (78.8% in Ukraine, 71.1% abroad). Almost 90% of respondents in Ukraine and abroad consider themselves emotionally attached to the Ukrainian nation and Ukraine as a country.
- Criteria of Ukrainian identity. There is no consensus on what it means to be a “true Ukrainian.” Half of the respondents chose the following groups of criteria: symbolic self — identification, language skills, cultural affiliation, and civic duties. Formal criteria for belonging, such as birth, citizenship, Ukrainian origin, etc., were chosen by only a third of respondents. This indicates a strong but multidimensional identity that integrates cultural and civic components.
- Limited tolerance towards certain groups. Despite general openness to diversity, a quarter of respondents in Ukraine (23.9%) and 14.2% abroad are not ready to live next to LGBT people. The highest social distance is recorded towards people who abuse alcohol (76% in Ukraine, 82% abroad) or drugs (80% in Ukraine, 90% abroad).
- Involvement in community support. The vast majority of respondents (85.4% in Ukraine and 87% abroad) reported participating in aid initiatives. Most often, this was through donations (51.9% and 55%, respectively).
- Cultural relevance. 61.8% of respondents in Ukraine are satisfied with cultural events in their region. Almost 20% are unsure. This question was not asked to respondents abroad.
- Relative deprivation. 9% in Ukraine and 19.3% abroad consider themselves discriminated against. Men report discrimination more often. One in five respondents in Ukraine (19.4%) and one in four abroad (25.3%) believe that they had fewer opportunities in life to ensure that their rights were not violated.
Political Dimension: High Interest, Low Agency, and Fragmented Trust
The political dimension reveals the level of vertical cohesion: the ability of citizens to influence political processes, feel represented, and trust institutions of power. Despite sustained interest in politics, the results show a deep gap between expectations and perceived influence, which undermines trust in democratic mechanisms and may fuel political apathy or radicalization.
- Potential for civic engagement. 70.5% of respondents in Ukraine and 80.3% abroad are interested in politics. Men demonstrate a higher level of interest. High interest indicates potential for participation, but is not accompanied by a sense of influence.
- Limited perceived political representation and influence. Despite high interest in politics, only 10.9% in Ukraine and 14.2% abroad feel able to participate in political life. Only 2.2% in Ukraine and 1.6% abroad believe that politicians understand people like them. Only 7.6% in Ukraine and 10.4% abroad believe that the system allows people in their position to influence the government.
- Limited belief in the influence of the vote. Only around 40% of respondents believe that their vote matters at national or local level.
- High potential for participation, but limited confidence in impact. Most respondents always or usually vote in elections. Half of them feel confident in their ability to participate in elections, but only a third of respondents in Ukraine and half abroad are willing to join protests or demonstrations if they feel the need to do so.
- Low level of actual engagement. Almost half of respondents did not participate in any form of civic or political activity in the last year. The most common action was addressing utility issues (16.2% in Ukraine).
- Trust in institutions: selective and situational. The average institutional trust index is 5.3 out of 10, indicating a moderate or contextual level of trust in institutions. This indicates limited vertical cohesion:
- The courts, government, and parliament have the lowest trust ratings: only 2% to 5% trust them completely, while over 60% express distrust.
- Higher trust in individual institutions: president: 58% positive rating in Ukraine, 56% abroad; 25.5% complete trust. Women and people with military experience demonstrate higher levels of trust.
- Local authorities: 33.4% positive rating in Ukraine, 25% abroad.
- Employment centers have an average level of trust: 50% in Ukraine, 39% abroad.
Media Dimension: Fragmented Trust, Low Representation and Widespread Self — Censorship
- Fragmented trust in the media. Only half of respondents in Ukraine (49.4%) and 58.8% abroad generally trust the news they consume. Less than 10% trust it completely. A third of respondents in Ukraine and a quarter abroad express distrust. People with higher education have lesss trust.
- News sources: social media and messengers are the main channels. Respondents most often get their news from Ukrainian media pages on social media and messengers (46.7%). Bloggers are the second most popular source (30–32%), especially among men and people with higher education. Traditional media have limited influence. Ukrainians abroad rely more on information from relatives and friends.
- Invisibility in the media. Most respondents (57% in Ukraine, 58.5% abroad) were unable to determine whether their experience or identity was represented in the media. Only 20.4% in Ukraine and 19.7% abroad believe that their political views are adequately covered. Other aspects — military experience, disability, IDP status — are mentioned much less frequently (7–11%).
- Doubts about media objectivity. Only a third of respondents (32.4% in Ukraine, 31.3% abroad) consider news about people with similar experiences to be objective. About 40% do not have a clear opinion, which may indicate distrust of journalistic standards or frustration.
- Demand for visibility of “people like me.” About half of respondents (42.2% in Ukraine, 45.8% abroad) want to see more people like themselves in the news. This is particularly pronounced among men and respondents with military experience.
- Low visibility of personal experience in the media. Only a third of respondents sometimes see people with similar experiences in the media (31.3% in Ukraine, 29% abroad). A quarter say they almost never see such content (25.1% in Ukraine, 29.4% abroad), and up to 15% do not notice it at all.
- Biased coverage. Up to a quarter of respondents have encountered biased portrayals of their own experiences in the media: 16.9% in Ukraine and 25.5% abroad — often, and another quarter — sometimes. This is most often reported by men and people with military experience.
- Self — censorship and fear of speaking out. A third of Ukrainians in Ukraine and almost half abroad avoid expressing their opinions publicly for fear of condemnation or misunderstanding.
- Pessimism about representation in the media. Only 1% believe that the media already covers all social groups fairly. Half believe that fair representation is unlikely even in the future.
Economic Dimension
Economic stability is not only a factor of social cohesion, but also its prerequisite. Economic disparity is a classic source of social fragmentation. It shapes hierarchical models of interaction between the more and less affluent people at the horizontal level (in everyday interactions within the community, professional circles, educational environment, or neighborhood) leading to a decline in trust and solidarity within the community. Objective or perceived economic vulnerability also undermines so — called vertical cohesion, i.e., the relationship between individuals and the authorities (central or local), because when people are unable to meet their basic needs for a long time, their trust in the welfare state drops, since of the state's key functions is to support and protect citizens who find themselves in difficult life circumstances.
Social cohesion implies equal opportunities for all community members to fully participate in social political life and fulfil their own potential, including in the economic life of the community. The inability to secure decent living conditions reduces individuals' sense of agency, as well as their desire and ability to invest their own efforts and resources in the well — being of their community—whether it be a neighborhood, village, city, community, or state. In conditions of widespread poverty and wealth inequality, the common good loses its value for members of that society.
Within the economic dimension, we examined the existence of both objective and subjective barriers that affect respondents' ability to actualize their economic potential and participate fully in the economic life of society. By objective barriers, we mean the lack of access to basic economic resources that form the material basis of well — being, such as housing, food, health care, as well as access to opportunities in the labor market and education. Subjective barriers included feelings of economic vulnerability, limited ability to plan for the future, and a reduced sense of fairness in the distribution of economic opportunities.
To this end, we analyzed the following groups of indicators:
- economic well — being and life stability: difficulties in paying bills, meeting basic needs in the event of income loss, experience of material instability during the year (lack of food, medicine, housing, or income), housing security;
- access to basic components of well — being: access to goods, services, and conditions considered essential for a decent standard of living (including household appliances, food, vacation, access to doctors, etc.);
- perception of one's own economic vulnerability: a general feeling of material hardship (“I have difficulty making ends meet”), perception of one's own position in relation to access to education, employment, social services, and housing compared to other citizens;
- economic autonomy and survival strategy: the type of resources that respondents rely on in case of loss of their main income (personal savings, state assistance, credit, etc.);
- purchasing behavior as a manifestation of subjective economic confidence: frequency of consumption of goods and services related to leisure and recreation.
These indicators make it possible to assess both the level of respondents' actual integration into the economic life of society and the barriers that weaken their economic confidence, independence, and subjective sense of well — being.
Employment
Only half of respondents have paid work (48.4% among Ukrainians in Ukraine and 55.7% abroad). Almost a quarter of respondents in Ukraine are retired (20.1%). Among Ukrainians abroad, the shares between other employment categories are distributed almost evenly, with the largest share among those who do not have paid work receiving only social benefits (7.4%) or doing housework, childcare, or caring for other people (7.3%). It is noteworthy that although respondents abroad have approximately the same level of employment as respondents in Ukraine, the share of respondents with higher or incomplete higher education in this group is significantly higher — 76.2% compared to 58.5% among respondents in Ukraine. This indicates the difficulties faced by some respondents in applying their professional skills and experience in the foreign labor market. It is also more difficult to find paid work for respondents with general secondary and secondary vocational education — 28% and 38.7%, respectively, while 57.7% of respondents with higher education have paid jobs.
There are significant differences in employment rates among vulnerable groups. The lowest employment rate is among respondents with disabilities — only 25.1% have paid work. Among respondents with IDP status, the employment rate is slightly lower — 40.9% of them have paid work compared to 49.5% of respondents without such status. IDPs are also more likely to be engaged in domestic or care work — 10.8% compared to 5.9% of respondents without IDP status. Although the employment rate for men and women does not differ significantly (50% and 46.9%, respectively), women are significantly more likely to be engaged in domestic care work — 10.8% compared to 1.5% among men.
We did not observe any noticeable differences in employment rates based on differences in war experience or language spoken by respondents.
|
Which of the options best describes your situation over the past 7 days? |
Ukraine |
Abroad |
|
Paid job or on a temporary leave (an employee, self — employed, individual enterpreneur, work in a family business) |
48.4% |
55.7% |
|
Study (not paid by an employer), including school break |
2.4 |
6.3% |
|
I receive social payments only |
2.2 |
7.4% |
|
Jobless, but I am an active job — seeker |
5.5 |
5.3% |
|
Jobless, but I am NOT a job — seeker |
1.8 |
2% |
|
Chronically ill or unable to work |
2.1 |
2% |
|
Retired |
20.1% |
6.1% |
|
Military service |
4.2% |
0.2% |
|
Hosehold work, taking care of children or other persons |
6.6% |
7.3% |
|
Other |
5.2% |
6.3% |
|
Prefer not to answer |
1.6% |
1.4% |
Financial stability
Overall, respondents have a fairly low level of financial stability.
Only 8.4% of respondents would be able to meet their basic needs (such as housing, food, and medicine) if they lost their main source of income regardless of the circumstances, while another 9.4% said they would be able to do so for six months. One — third of respondents indicated that they would not be able to meet their basic needs at all (29.3%). Respondents abroad were slightly more likely to indicate that they would be able to meet their basic needs: 13.2% of respondents abroad chose this option regardless of circumstances, and 10.3% for more than six months.
|
How would you assess your capacity to provide for your basic needs (such as housing, food, and medication) in case of losing your primary source of income? ONE ANSWER |
Ukraine |
Abroad |
|
I will be able to fully provide for myself, regardless of circumstances |
8.4% |
13.2% |
|
I will be able to provide for my basic needs for over 6 months |
9.4% |
10.3% |
|
I will be able to provide for my basic needs for 1 to 6 months |
17.0% |
20.9% |
|
I will be able to provide for my basic needs for less than 1 month |
17.6% |
17.2% |
|
I will not be able to provide for my basic needs |
29.3% |
24.5% |
|
Not sure |
15.9% |
12.2% |
|
Prefer not to answer |
2.4% |
1.7% |
Women are much more vulnerable in economic terms than men: female respondents are half as likely to be able to support themselves regardless of circumstances as male respondents (5.9% vs. 11.3%), as well as to be able to support themselves for more than six months (12.9% among men and 6.5% among women). In addition, one — third of women surveyed said they would be unable to provide for themselves at all if they lost their income (35.4% compared to 22% of men).
|
GENDER |
||
|
How would you assess your capacity to provide for your basic needs (such as housing, food, and medication) in case of losing your primary source of income? ONE ANSWER |
M |
F |
|
I will be able to fully provide for myself, regardless of circumstances |
11.3 |
5.9 |
|
I will be able to provide for my basic needs for over 6 months |
12.9 |
6.5 |
|
I will be able to provide for my basic needs for 1 to 6 months |
19.6 |
15 |
|
I will be able to provide for my basic needs for less than 1 month |
15.3 |
19.6 |
|
I will not be able to provide for my basic needs |
22 |
35.4 |
|
Not sure |
16.5 |
15.4 |
|
Prefer not to answer |
2.3 |
2.2 |
Respondents with disabilities also face significantly greater difficulties in meeting their basic needs in the event of loss of their main source of income: 42.4% of respondents with disabilities will not be able to support themselves at all, compared to 27.7% of respondents without disabilities. It is noteworthy that respondents who have the requested war experience are slightly more confident in their ability to provide for themselves — 9.2% will be able to fully provide for themselves regardless of the circumstances (compared to 6.4% of respondents without such experience), and another 18.5% will be able to provide for their own needs for less than 1 month, compared to 15.7% of respondents without such experience (among other response options, the results are almost identical).
At the same time, 19.4% of respondents had been without any cash income during the last year (both in Ukraine and abroad), and another 10.1% had been unable to obtain necessary medicines or medical services (this was more common among respondents abroad, at 15%). Respondents abroad were more likely to be without a permanent place of residence — 14.4% compared to 6.5% of respondents in Ukraine. Respondents with disabilities were also significantly more likely to lack access to necessary medicines or medical services than respondents without disabilities — 21.9% compared to 8.5%.
|
Which of the below has happened to you over the year? SEVERAL ANSWERS POSSIBLE |
Ukraine |
Abroad |
|
Stayed without a sufficient amount of food |
4.6% |
5.4% |
|
Felt unprotected against crime in one’s own home (e.g., attack, burglary, violence, etc.) |
2.4% |
3.4% |
|
Stayed without the necessary medication or medical services you needed |
10.1% |
15.0% |
|
Stayed without cash income |
19.4% |
19.4% |
|
Stayed without a permanent address |
6.5% |
14.4% |
|
None of the above happened to me |
56.0% |
56.9% |
|
Not sure |
8.7% |
4.1% |
|
Prefer not to answer |
3.0% |
2.2% |
In the event of loss of income, only one — third of respondents in Ukraine have financial savings that can cover their basic needs (35.4%), while among respondents abroad, half of respondents (52.9%) have savings. Also, to cover their basic needs if they lose their income, a third of respondents both in Ukraine and abroad (36.3% and 37.8%, respectively) count on support from family or friends. Another quarter of respondents in Ukraine will support themselves through gardening or horticulture (24.8%), while respondents abroad are more likely to rely on social assistance from the host country in case of loss of income (27.7%). Here, we do not observe significant differences by gender, disability, or war experience. At the same time, respondents with IDP status are more likely to count on humanitarian aid from international or non — governmental organizations (23.1% vs. 6.7% among non — IDPs) and social assistance from the state (31.3% vs. 11.4% among non — IDPs).
|
What resources do you use to provide for your basic needs in case of losing a primary source of income? SEVERAL ANSWERS POSSIBLE |
Ukraine |
Abroad |
|
My own savings |
35.4% |
52.9% |
|
Private household (growing vegetables, gardening) |
24.8% |
1.0% |
|
Support from family or friends |
36.3% |
37.8% |
|
Humanitarian assistance from NGOs and international organizations |
8.9% |
11.2% |
|
Social benefits fromthe state |
14.0% |
27.7% |
|
Sold property or personal belongings |
11.4% |
12.3% |
|
Credit funds or loans |
17.0% |
9.9% |
|
Other resources |
8.2% |
5.9% |
|
Not sure |
8.7% |
9.1% |
|
Prefer not to answer |
3.5% |
3.5% |
In terms of housing, the situation is more optimistic — the majority of respondents in Ukraine live in their own homes (63.5%). However, 14.4% are uncertain and said that it is difficult for them to say how long they will be able to use the housing they currently live in. Another 10.3% said they would be able to use their homes for at least another year, while a total of 8.8% of respondents said they could lose access to their current homes within a year.
Among respondents abroad, half are confident that they will be able to use their housing for at least another year (51.1%), while 6.3% live in their own housing abroad. 7.3% of respondents abroad may lose access to their homes in the next 7 — 12 months, and another 13.7% within a shorter period of time. Uncertainty among respondents abroad is slightly higher than in Ukraine: 18.5% of respondents chose the option “not sure.”
|
According to your estimates, how long would you be able to live in a place you are currently staying in? ONE ANSWER |
Ukraine |
Abroad |
|
You may lose access to housing in the near future |
2.8% |
2.8% |
|
You may lose access to housing in the coming 2 or 3 months |
2.8% |
5.8% |
|
You may lose access to housing in 4 or 6 months |
2% |
5.1% |
|
You may lose access to housing in the closest 7 or 12 months |
1.2% |
7.3% |
|
You are certain that you will be able to use your housing for at least another year |
10.3% |
51.1% |
|
I live in my own place |
63.5% |
6.3% |
|
Not sure |
14.4% |
18.5% |
|
Prefer not to answer |
3.0% |
3.1% |
The situation is more difficult for internally displaced persons: as few as 18.2% of these respondents live in their own homes; while another 20.8% are certain they could use their current housing for at least another year. Almost a third of respondents who are IDPs chose the option “not sure.” Almost a quarter said they could lose access to housing between now and six months from now, with 8.2% of them likely to lose their homes in the near future. We did not observe any significant differences based on gender, disability, or other experiences of war.
|
IDP status |
||
|
According to your estimates, how long would you be able to live in a place you are currently staying in? ONE ANSWER |
IDP |
non — IDP |
|
You may lose access to housing in the near future |
8.2 |
2 |
|
You may lose access to housing in the coming 2 or 3 months |
7.4 |
2.1 |
|
You may lose access to housing in 4 or 6 months |
6.3 |
1.3 |
|
You may lose access to housing in the closest 7 or 12 months |
4.1 |
0.7 |
|
You are certain that you will be able to use your housing for at least another year |
20.8 |
8.7 |
|
I live in my own place |
18.2 |
70.3 |
|
Not sure |
33.5 |
11.5 |
|
Prefer not to answer |
1.5 |
3.3 |
Economic Capacity
The economic capacity of respondents is quite low, too.
More than half of respondents in Ukraine said that they find it difficult to make ends meet (52.6%), while abroad there were almost one third of such answers (31.7%). Here, we also see a trend of lower economic vulnerability among women than among men: more than half of women (59.8%) agreed with this statement, compared to 44% of men. We did not find any statistically significant differences based on IDP status, war experience, or disability.
We observe the same trend in the context of difficulties with paying bills at the end of the month, such as utility bills, loan payments, education services, and other financial liabilities. Here, too, half of respondents said they had faced these difficulties most of the time or from time to time over the past year (16% most of the time and 34.7% from time to time), compared with 31.9% abroad (7.4% most of the time and 24.5% from time to time). Women also face more difficulties paying bills than men (57.2% and 43.2%, respectively).
|
I find it difficult to make the ends meet |
Ukraine |
Abroad |
|
Completely agree |
19.2% |
7.8% |
|
Partially agree |
33.4% |
23.9% |
|
Partially disagree |
13.9% |
18.1% |
|
Completely disagree |
19.1% |
39% |
|
Not sure |
9.5% |
7.8% |
|
Prefer not to answer |
4.9% |
3.4% |
At the same time, we can see differences depending on IDP status: internally displaced persons are slightly more likely to have difficulties paying their bills: 22.8% of respondents faced such difficulties most of the time during the last year, compared to 15% of respondents who are not displaced persons.
In terms of daily well — being, we can see a widespread lack of access to basic resources to meet personal needs. Only half of respondents in Ukraine (50.8%) had food with meat, fish, or vegetarian alternatives every other day, slightly more than half had access to a mobile or landline phone (70%), a washing machine (62.6%), and heating to maintain adequate warmth in their homes (61.3%). 42.7% of respondents had access to timely medical care. Only 12.5% of respondents were able to take a vacation away from home. We did not find significant differences in this regard based on gender, IDP status, disability, or war experience.
The level of everyday kindness among respondents abroad is significantly higher than among respondents in Ukraine. Respondents abroad are much more likely to be able to take a week's vacation away from home (41.8%), eat meat, fish, or vegetarian alternatives every other day (81.8%), visit doctors on time (57.9%), and have access to a washing machine (81.5%) and a telephone (87.1%).
|
Over the past year, have you had access to the following things: SEVERAL ANSWERS POSSIBLE |
Ukraine |
Abroad |
|
Mortgage loans or other loan payments |
11.7% |
7.1% |
|
A week long vacation away from home |
12.5% |
41.8% |
|
Meals with meat, fish, or vegetarian alternatives every other day |
50.8% |
81.8% |
|
Mobile phone or a landline |
70% |
87.1% |
|
Timely visits to doctors |
42.7% |
57.9% |
|
Washing machine |
62.6% |
81.5% |
|
Car |
29.2% |
31.1% |
|
Heating to maintain the right temperature in your home |
61.3% |
76.0% |
|
Not sure |
9.6% |
3.3% |
|
Prefer not to answer |
5.8% |
2.7% |
In terms of additional benefits, respondents rarely choose non — essential items. To entertain or cheer themselves up, respondents living in Ukraine most often buy food (51.4%), household goods (22.9%), or new clothes or shoes (21.9%). Going to a café, restaurant, or bar was chosen by 16% of respondents, while all other options were chosen by less than 8.5% of respondents.
The opportunities and preferences of respondents abroad differ significantly from those of their compatriots. Respondents abroad most often chose going to a café, restaurant, or bar (40.1%), new clothes or shoes (38.8%), food (35.7%), beauty and personal care (23.2%), and travel (23%).
|
Over the past month, when you wanted to entertain or make yourself happy, what categories of goods and services have your bought most often? MAX THREE ANSWERS |
Ukraine |
Abroad |
|
Subscription to online services |
5.4% |
7.3% |
|
Going to a cafè, restaurant, or bar |
16.0% |
40.1% |
|
Travel |
5.0% |
23.0% |
|
New cloths or footwear |
21.9% |
38.8% |
|
Beauty and personal care |
10.7% |
23.2% |
|
Household appliances |
6.4% |
3.4% |
|
Home goods |
22.9% |
12.8% |
|
Jewelery and accessories |
1.0% |
5.1% |
|
Food |
51.4% |
35.7% |
|
Alcoholic drinks |
5.7% |
8.7% |
|
Sport |
5.6% |
8.5% |
|
Books |
8.3% |
8.8% |
|
Pet treats and toys |
6.0% |
5.1% |
|
Video games |
4.4% |
6.5% |
|
Toys |
1.8% |
1.8% |
|
Visit to a cinema, theater, or museum |
6.5% |
7.7% |
|
Other entertainment outside your home |
3.4% |
8.7% |
|
Other entertainment at home |
6.3% |
3.0% |
|
None of the above |
7.4% |
2.8% |
|
Not sure |
4.9% |
1.4% |
|
Prefer not to answer |
1.9% |
2.6% |
Relative Deprivation
Another important indicator of economic inclusion is relative deprivation— it is not the actual level of provision, but rather the perception of one's own inequality compared to others. Relative deprivation is a state in which a person believes that 1) they have not received or are not receiving the benefits or advantages to which they are entitled or deserve, and 2) that they are receiving less than other people similar to them. Prolonged deprivation is often one of the factors contributing to a decline in solidarity with one's community, expressions of political dissent, and potential radicalization. Overall, we observe an average or moderate level of relative deprivation among respondents regarding the equality of their opportunities in access to education, employment, social services, and housing.
Respondents rate their access to comfortable housing highest: 68.5% of respondents in Ukraine and 77% of respondents abroad agree that, compared to other people in Ukraine, they had sufficient opportunities to live in comfortable housing. The sensitivity of the housing problem for IDPs is also observed in terms of relative deprivation: among respondents with IDP status, 58.2% agree with the statement, compared to 70.1% of respondents who are not IDPs.
|
Compared to other people in Ukraine, I have had enough chances to live in a comfortable house / Compared to other people in Ukraine, before I left abroad, I had had enough chances to live in a comfortable house |
Ukraine |
Abroad |
|
Completely agree |
30.5% |
51.8% |
|
Partly agree |
38.0% |
25.2% |
|
Partly disagree |
9.7% |
10.0% |
|
Completely disagree |
9.6% |
12.0% |
|
Not sure |
9.3% |
0.6% |
|
Prefer not to answer |
2.9% |
0.4% |
Respondents also rate their educational opportunities quite highly — 68.2% of respondents in Ukraine agreed that, compared to other people in Ukraine, they had sufficient opportunities to achieve the level of education they wanted. Respondents abroad share a similar view, with only one difference: they were slightly more likely to have no doubts about their educational opportunities and chose the option “strongly agree” (53.6% compared to 40.2% of respondents in Ukraine). We did not find any significant differences by gender, IDP status, disability, or war experience. 13.5% of respondents in Ukraine and 5.9% abroad did not specify their opinion.
|
Compared to other people in Ukraine, I have had enough chances to reach the level of education I wanted / Compared to other people in Ukraine, before I left abroad, I had had enough chances to reach the level of education I wanted |
Ukraine |
Abroad |
|
Completely agree |
40.2% |
53.6% |
|
Partly agree |
28% |
16.6% |
|
Partly disagree |
7% |
6.3% |
|
Completely disagree |
6.1% |
12.4% |
|
Not sure |
13.5% |
5.9% |
|
Prefer not to answer |
5.2% |
5.2% |
Similarly, more than half of respondents highly value their career opportunities relative to others in Ukraine: 62.8% of respondents in Ukraine and 66% agree that they had enough opportunities to get the job they wanted. The same trend can be observed across different groups of respondents: respondents abroad are more likely to assess their career opportunities positively (40% strongly agree compared to 28.3% of respondents in Ukraine), while no differences between other groups of respondents and the national average were found. At the same time, respondents with different levels of education rate their chances of getting the job they want slightly lower than others: among respondents with higher or incomplete higher education, 68.9% assess their chances of getting the job they want positively, while among those with secondary vocational education, the figure is 56.2%, and among those with general secondary education, 55.6%. 11.7% of respondents in Ukraine and 3.6% abroad were undecided.
|
Compared to other people in Ukraine, I have had enough chances to get the job I wanted / Compared to other people in Ukraine, before I left abroad, I had had enough chances to get the job I wanted |
Ukraine |
Abroad |
|
Completely agree |
28.3% |
40.0% |
|
Partly agree |
34.5% |
26.0% |
|
Partly disagree |
10.0% |
10.3% |
|
Completely disagree |
11.7% |
17.5% |
|
Not sure |
11.8% |
3.6% |
|
Prefer not to answer |
3.7% |
2.6% |
More than half of respondents in Ukraine (66%) and almost a third of respondents abroad (71.2%) agree that they had sufficient opportunities to access the social services to which they are entitled. It is noteworthy that respondents who had at least one of the war experiences mentioned in the survey were slightly more likely to assess their access to social services positively — 67.5% compared to 61.7% of respondents who did not have such experience. No differences were found in other categories of respondents. 10.4% of respondents in Ukraine and 4.5% abroad were undecided.
|
Compared to other people in Ukraine, I have had enough chances to receive social services I am entitled for (such as medical care, administrative services, benefits, etc.) / Compared to other people in Ukraine, before I left abroad, I had had enough chances to receive social services I am entitled for (such as medical care, administrative services, benefits, etc.) |
Ukraine |
Abroad |
|
Completely agree |
29.7% |
44.0% |
|
Partly agree |
36.3% |
27.2% |
|
Partly disagree |
11.1% |
9.3% |
|
Completely disagree |
9.0% |
13.6% |
|
Not sure |
10.4% |
4.5% |
|
Prefer not to answer |
3.4% |
1.4% |
Social Dimension
Within the social dimension, we examined barriers that affect respondents' ability to interact with other members of society, feel like they are a full part of it, and identify themselves as part of a shared political and social community. Particular attention was paid to factors that weaken feelings of trust, belonging, recognition, or create obstacles to a sense of inclusion in a shared value field.
Therefore, we analyzed the following groups of indicators:
- interpersonal trust and basic ideas about social relationships;
- sense of significance and social support: subjective feeling that daily activities have meaning and significance, that a person is needed by the community, mutual assistance;
- emotional attachment to the community: a sense of connection to the locality, region, Ukraine, and the Ukrainian nation;
- local and personal agency: assessment of the ability to influence one's own life and the situation in the immediate environment;
- feelings of deprivation in access to rights and opportunities;
- participation in social mutual assistance: experience of charitable, volunteer, and neighborly support;
- level of social distance and perceptions of acceptable commonality: willingness or unwillingness to live alongside members of different social groups (based on language, religion, health, lifestyle, status, etc.);
- sense of belonging and identification with the community: self — identification (with the local, regional, national, ethnic or supranational community), as well as a sense of pride in belonging to Ukrainian citizenship;
- perceptions of the criteria for belonging to the Ukrainian community: assessment of the importance of various factors for national identity (citizenship, knowledge of the language, participation in defense, sharing of culture, history, customs, consumption of Ukrainian cultural products, etc.);
- value integration into the environment: perception of the compatibility of cultural and public life in the place of residence with the personal interests and values of the respondent.
These indicators allow for a comprehensive assessment of the level of social integration, sense of belonging, subjective recognition, and the depth of the respondent's symbolic connection with Ukrainian society as a political, social, and value community.
Horizontal Dimension: Community
Overall, respondents demonstrate a low level of general interpersonal trust. Only one — fifth of those surveyed in Ukraine (20.9%) and less than 18% of those abroad believe that most people can be trusted. On the other hand, most respondents (over two — thirds in Ukraine and over three — quarters abroad) believe that people should be treated with great caution. This pattern does not show statistically significant differences by gender, IDP status, or experience of disability or war.
|
In your opinion, can you generally trust most people or do you need to cautious in relations with them? |
Ukraine |
Abroad |
|
Most people can be trusted |
20.9% |
17.8% |
|
You need to be cautious with people |
68.9% |
76.2% |
|
Not sure |
9.5% |
5.5% |
|
Prefer not to answer |
0.7% |
0.4% |
This general pessimism towards other people is confirmed by the answers to the next question in this section. Specifically, two — thirds of respondents in Ukraine (66.1%) and almost three — quarters abroad (74.5%) believe that people mostly care only about themselves. Only one in six respondents believe that people try to help others.
|
In your opinion, do people mostly try to help others or rather take care of themselves? |
Ukraine |
Abroad |
|
People mostly take care of themselves |
66.1% |
74.5% |
|
People mostly try to help others |
17.8% |
13.6% |
|
Not sure |
15.1% |
11.3% |
|
Prefer not to answer |
1% |
0.6% |
When asked about a hypothetical situation in which others could take advantage of a person for their own benefit, most respondents tended to believe that this would happen: 28% in Ukraine and 33% abroad responded that they would most likely be exploited. Only a third of respondents believe that most people would behave decently in such a situation. At the same time, one in almost three respondents was unable to give a clear answer, which may indicate deep uncertainty in their attitude toward others or a lack of established ideas about social trust. The only clear social difference is by gender: men are slightly more likely to believe that others would take advantage of them for their own benefit (34.2% vs. 22.8% among women), while women are slightly more likely to believe that others would behave decently. At the same time, women more often choose the answer “not sure,” which may indicate caution or emotionally based skepticism.
|
If they get a chance, would most people try to make use of you for the sake of their interests or would they treat you decently and honestly? |
Ukraine |
Abroad |
|
Most people would use me in their interests |
28% |
33% |
|
Most people would treat me decently and honestly |
37.3% |
32.4% |
|
Not sure |
32.3% |
33.3% |
|
Prefer not to answer |
2.4% |
1.4% |
The overall level of interpersonal trust can be assessed as low, with a prevailing cautious or distrustful attitude towards other people. This situation poses a risk to horizontal cohesion, as weak trust prevents spontaneous cooperation, reduces willingness to help others, and weakens the effect of social capital. Although differences between social groups are minimal, men show higher levels of distrust towards others, which may require further research on the impact of gender roles and war experience on social perceptions.
Social Inclusion Index
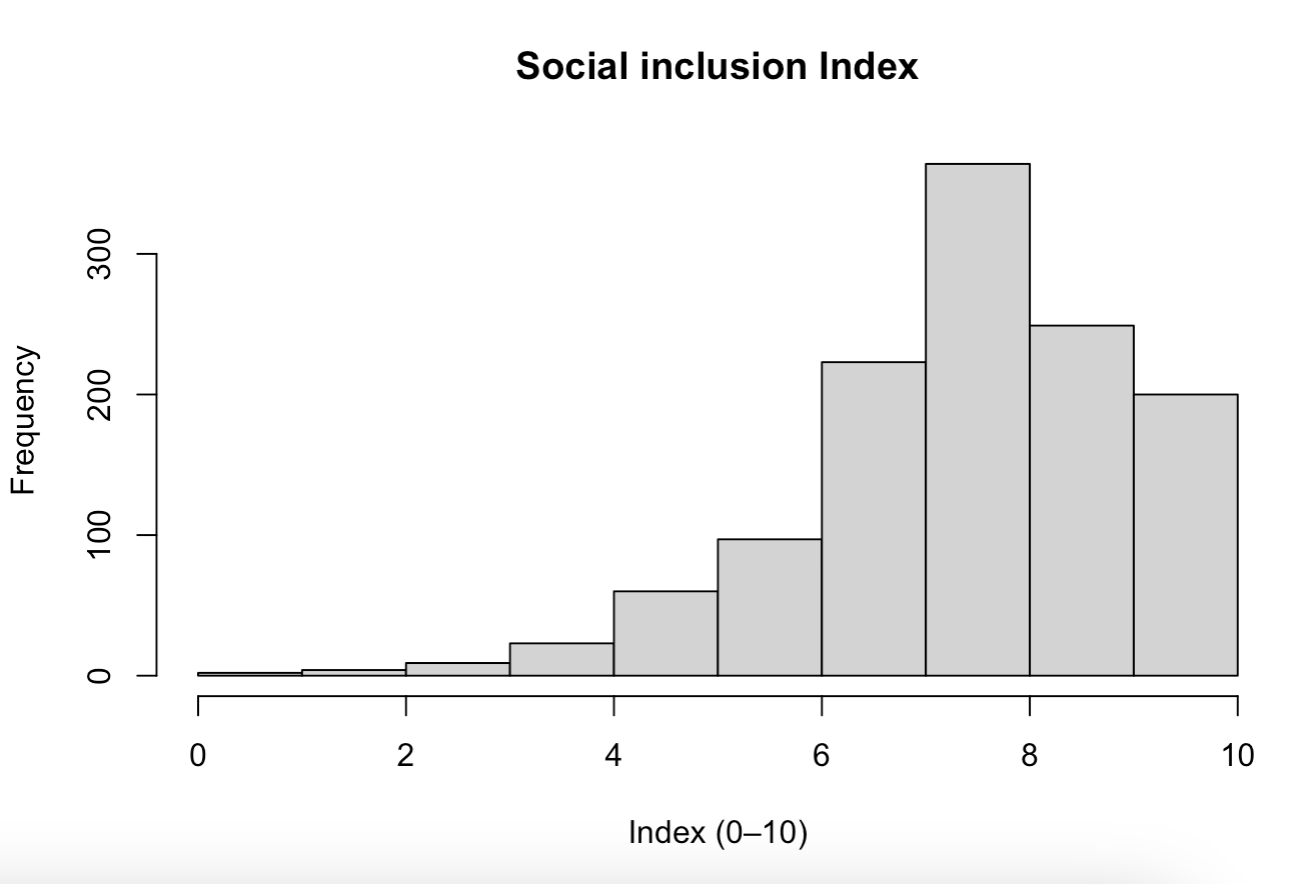
To better understand how people perceive their place in society, we calculated the Experiences of Social Inclusion Scale (ESIS). This index reflects the extent to which people feel trust, their own value in the community, and their ability to influence their environment — key components of meaningful social inclusion, especially in times of crisis, mobility, and change.
To this end, we adapted the social inclusion experience scale developed by researchers at the Finnish Institute for Health and Welfare. The scale consists of seven statements related to personal initiative, trust, and social integration. Respondents rated their agreement on a scale from “strongly agree” to “strongly disagree.” The questions on the scale were selected to comprehensively cover the experience of social inclusion in one's community, including not only trust in others and safety in the community, but also a sense of self — worth, agency, and belonging in one's community.
On a scale of 0 to 10, the average and median scores are 7.4, indicating a high level of social inclusion. The lower quartile (Q1 = 6.67) shows that only 25% of respondents have an index score below this level, while the upper quartile (Q3 = 8.56) indicates a consistently high level of responses among the majority of respondents. In other words, most respondents demonstrate a fairly high and consistent sense of inclusion in their community.
The scale itself is statistically reliable. It demonstrates high internal reliability (Cronbach's alpha = 0.78), which means that the eight items are well combined to measure a single, coherent concept. The consistency of the index allows for reliable comparisons between different groups, such as displaced persons, gender groups, or regional groups.
These results are confirmed by high percentages of agreement with individual statements on the scale. For example, the vast majority of respondents (around 80% or more) say that they “feel trusted” and “can influence certain things in their environment.” Also, more than two — thirds of respondents in Ukraine “feel needed by their community.”
Although the level of agreement declines somewhat for some items, particularly regarding access to assistance and feelings of being needed by respondents abroad, the overall high Social Inclusion Index score indicates that most respondents feel a strong connection to their community, a sense of self — worth, and the ability to influence their lives and community.
Respondents' answers to each statement on the scale
Overall, more than two — thirds of respondents say they feel that those around them trust them (80.6% in Ukraine and 77.1% abroad). Women are slightly more likely to hesitate when asked whether they feel trusted: 13% of female respondents chose the option “Not sure,” compared to 7.4% of male respondents. Respondents who have had at least one of the war experiences asked about are also slightly more likely to say that they feel trusted than respondents who have not had any of the war experiences listed (82.8% compared to 75.7%). We do not observe any significant differences depending on the level of education, disability, or IDP status.
|
I feel that people trust me |
Ukraine |
Abroad |
|
Completely agree |
34.5% |
32.5% |
|
Partly agree |
46.1% |
44.6% |
|
Partly disagree |
5.1% |
9.7% |
|
Completely disagree |
1.9% |
3.2% |
|
Not sure |
10.4% |
8.6% |
|
Prefer not to answer |
2.1% |
1.4% |
We observe the same trend in relation to whether respondents feel they can influence certain things in their environment. Most often, respondents declare that they can influence their environment (82% in Ukraine and 86.1% abroad). We note that respondents abroad more often chose the option “strongly agree” — almost 40%, while among respondents in Ukraine, only a quarter of respondents answered unequivocally in the affirmative. We do not observe any significant differences by gender, IDP status, disability, education, or war experience.
|
I can influence certain things in my environment |
Ukraine |
Abroad |
|
Completely agree |
26.9% |
39.3% |
|
Partly agree |
55.1% |
46.8% |
|
Partly disagree |
5.1% |
5.7% |
|
Completely disagree |
2.7% |
2.9% |
|
Not sure |
8.6% |
3.7% |
|
Prefer not to answer |
1.5% |
1.6% |
Respondents indicated that they could influence the course of their own lives slightly less frequently: 76.1% of respondents in Ukraine and 79.5% abroad agreed with this statement. Similarly, respondents abroad are more likely to choose “strongly agree” — almost half of respondents abroad chose this option (42.5%), while among respondents in Ukraine, slightly less than a third (30.6%) answered “strongly agree.” Respondents abroad are also less hesitant about this question than respondents in Ukraine: 3.2% and 8.1% chose the “Not sure” option, respectively.
Unlike in the previous questions, here we observe certain differences among vulnerable groups of respondents. Respondents with IDP status are less likely to indicate that they can influence the course of their own lives — 67.4% compared to 77.5% among non — IDPs. IDP respondents were also twice as likely to hesitate: 15% compared to 7% of non — IDPs. In contrast, respondents who had at least one of the war experiences asked about were twice as likely to hesitate as respondents without such experiences (5.8% compared to 13.3% without war experiences).
Only half of respondents in Ukraine said they receive assistance when they really need it — 56.4%, while abroad, slightly more respondents answered affirmatively — 67.4%. The trend of “Not sure” remains: twice as many respondents in Ukraine (15.1%) were unsure how to answer this question, compared to respondents abroad (7.3%). We did not find any significant differences on this issue based on IDP status, disability, gender, or education.
|
I receive help when I truly need it |
Ukraine |
Abroad |
|
Completely agree |
16.6% |
25.7% |
|
Partly agree |
39.8% |
41.7% |
|
Partly disagree |
11.6% |
11.4% |
|
Completely disagree |
13.7% |
12.7% |
|
Not sure |
15.1% |
7.3% |
|
Prefer not to answer |
3.1% |
1.2% |
Almost two — thirds of respondents in Ukraine said they feel needed by their community — 67.9%. Women are slightly more likely to hesitate on this issue than men — 18.8% chose “Not sure” compared to 10.2% of men. We did not find any significant differences based on IDP status, disability, education, or war experience.
|
I feel that my community/Ukraine (for the sample abroad) needs me |
Ukraine |
Abroad |
|
Completely agree |
30.9% |
20.3% |
|
Partly agree |
37% |
25.8% |
|
Partly disagree |
7.1% |
15.2% |
|
Completely disagree |
8.6% |
25.5% |
|
Not sure |
14.9% |
12.4% |
|
Prefer not to answer |
1.6% |
0.8% |
Among respondents abroad, this share is significantly lower — less than half of respondents agreed with the statement (46.1%). We also asked whether respondents feel needed in their country of residence — 48.1% answered affirmatively.
|
I feel that the country where I currently reside needs me |
Abroad |
|
Completely agree |
15.9% |
|
Partly agree |
32.2% |
|
Partly disagree |
14.9% |
|
Completely disagree |
23.7% |
|
Not sure |
12.8% |
|
Prefer not to answer |
0.4% |
Solidarity and Collective Identity
A sense of solidarity with one's community is one of the key and essential characteristics of a cohesive society, as it is precisely the factor that ensures compliance with the established social order and codified or uncodified rules. A sense of solidarity with those around us is also one of the incentives for altruistic behavior, i.e., making efforts or sacrificing resources for the benefit of others. In general, respondents show a moderate level of solidarity with their fellow citizens.
Two — thirds of respondents in Ukraine (75%) and abroad (70.9%) agree that people in Ukraine have a lot in common — a quarter of respondents in both Ukraine and abroad (26.9% and 24.1%, respectively) fully agree with this statement. In this category, we do not observe any differences by gender, IDP status, or disability. At the same time, we note some differences by language: respondents who speak mainly Russian or only Russian are slightly less likely to agree with this statement (64.8% and 40.5%, respectively).
|
Rate how much you agree or disagree with the following statement: People in Ukraine have much in common. ONE ANSWER |
Ukraine |
Abroad |
|
Completely agree |
26.9% |
24.1% |
|
Partly agree |
48.1% |
46.8% |
|
Partly disagree |
10.4% |
13.8% |
|
Completely disagree |
2.3% |
8.1% |
|
Not sure |
11.0% |
5.5% |
|
Prefer not to answer |
1.3% |
1.6% |
Respondents expressed similar levels of national pride: when asked if they were proud to be Ukrainian, 83.9% of respondents in Ukraine and 77.9% of respondents abroad answered positively. It is noteworthy that the majority of respondents both in Ukraine and abroad chose the highest level — “very proud” (66.6% and 53.8%, respectively). Here we see differences by gender — women are slightly more likely to be proud of their citizenship than men (89.4% of women versus 77.2% of men), with two — thirds of women (74.8%) and half of men (56.6%) choosing the highest level (“very proud”). People who have had at least one of the war experiences mentioned in the survey also report stronger patriotic feelings: 70.8% of respondents with such experience chose the option “very proud”, compared to 57.2% of respondents without such experience.
|
How much are you proud of being a citizen of Ukraine? ONE ANSWER |
Ukraine |
Abroad |
|
Very proud |
66.6% |
53.8% |
|
Somewhat proud |
17.3% |
24.1% |
|
Not very proud |
6.8% |
9.7% |
|
Not at all proud |
3.0% |
6.7% |
|
I am not a citizen of Ukraine |
0.1% |
0.2% |
|
Not sure |
3.9% |
3.5% |
|
Prefer not to answer |
2.3% |
2.0% |
National identity dominates with two — thirds of respondents, both in Ukraine and abroad: 78.8% of respondents in Ukraine and 71.1% of respondents abroad consider themselves citizens of Ukraine. When unable to select multiple answers, only 5.2% of respondents identify themselves primarily as residents of their locality, and 1.7% as residents of their region (Oblast). Among respondents abroad, the second most popular option is “citizen of the world,” chosen by 7% of respondents. National identity is also slightly more popular among women (83% compared to 74% of men) and respondents who have had at least one of the war experiences mentioned in the survey (80.9% compared to 74% of those who have not had such experiences).
|
Who do you see yourself in the first place? ONE ANSWER |
Ukraine |
Abroad |
|
A citizen of Ukraine |
78.8% |
71.1% |
|
A citizen of a country of residence |
— |
0.6% |
|
A resident of a settlement where I currently live |
5.2% |
1.8% |
|
A resident of a settlement I left because of the full — scale war / A resident of a settlement where I was born or used to live before moving abroad |
0.9% |
3.7% |
|
A resident of an Oblast I currently live in |
1.7% |
0.2% |
|
A resident of an Oblast I left because of the full — scale war / A resident of an Oblast I was born or used to live before moving abroad |
0.8% |
1.6% |
|
A member of ethnicity, nationality |
2.9% |
6.3% |
|
A citizen of a Soviet Union |
1.0% |
1.0% |
|
A citizen of Europe |
0.8% |
3.0% |
|
A citizen of the world |
3.9% |
7.0% |
|
Not sure |
2.0% |
2.6% |
|
Prefer not to answer |
1.9% |
1.0% |
We also decided to find out which components of Ukrainian identity are most important to respondents. Currently, there is no consensus among respondents on what it means to be a true Ukrainian: each of the criteria we proposed was chosen. The most popular criterion was a symbolic self — identification — “feeling Ukrainian.” It was selected by 52.8% of respondents in Ukraine and 65% abroad. The criterion of shared values with fellow citizens is also highly rated, without specifying which ones (37.7% in Ukraine and 45.5% abroad). The importance of language competences is also highly rated: knowing the Ukrainian language (57.8% in Ukraine and 68% abroad) and speaking it (47% in Ukraine and 45.5% abroad).
Cultural affiliation is often mentioned: the importance of sharing Ukrainian culture in order to consider someone Ukrainian was selected by 48.7% of respondents in Ukraine and 64.4% abroad, consuming Ukrainian cultural products — 41.3% in Ukraine and 51.2% abroad, as well as knowing the history of Ukraine (49% in Ukraine and 59.6%). Adherence to basic Ukrainian folk traditions was chosen somewhat less frequently: this criterion was selected by 33.6% of respondents in Ukraine and 34.3% of respondents abroad.
About half of respondents also supported an idea that fulfilling civic duties is an important part of Ukrainian identity for them, primarily supporting the Ukrainian Armed Forces (57.2% in Ukraine and 55% abroad). Slightly less than half of respondents marked the importance of respecting Ukraine's political institutions and laws (40.9% in Ukraine and 46.2% abroad), paying taxes (44.4% in Ukraine and 32.9% abroad), and participating in the defense of Ukraine (39.2% in Ukraine and 29.2% abroad). Caring for the environment has become a fairly popular criterion: it was chosen by 44% of respondents in Ukraine and 38.1% abroad. A third of respondents consider voting in elections to be an important criterion for belonging to the Ukrainian identity (32.4% in Ukraine and 32.1% abroad).
The least frequently selected criteria were passive affiliation with the Ukrainian nation: birth (23.5% in Ukraine and 25.7% abroad), Ukrainian citizenship (35.4% in Ukraine and 37.8% abroad), Ukrainian roots (22.8% in Ukraine and 29% abroad), and living in Ukraine for most of their lives (32% in Ukraine and 24.6% abroad).
The least popular criterion of identity is religion: only 16.8% of respondents in Ukraine and 10% of respondents abroad chose the option “being Christian.”
|
Some people say that the following things are important to be a true Ukrainain. Others believe they are not important. Which of the listed things are important for you personally to consider a person a true Ukrainian? SEVERAL ANSWERS POSSIBLE |
Ukraine |
Abroad |
|
To be born in Ukraine |
23.5% |
25.7% |
|
To respect political institutions and laws of Ukraine |
40.9% |
46.2% |
|
To have roots from Ukraine |
22.8% |
29.0% |
|
To speak Ukrainian |
47.0% |
45.5% |
|
To share Ukrainian culture |
48.7% |
64.4% |
|
To have a Ukrainian citizenship |
35.4% |
37.8% |
|
To live in Ukraine for the most part of one’s life |
32.0% |
24.6% |
|
To know the Ukrainian language |
57.8% |
68.0% |
|
To be a Christian |
16.8% |
10.0% |
|
To fell yourself a Ukrainian |
52.8% |
65.0% |
|
To know the history of Ukraine |
49.0% |
59.6% |
|
To share the same values with fellow citizens |
37.7% |
42.4% |
|
To take care of environemnt |
44.0% |
38.1% |
|
To participate in the defense of Ukraine |
39.2% |
29.2% |
|
To support the Defense Forces of Ukraine |
57.2% |
55.0% |
|
To pay taxes in Ukraine |
44.4% |
32.9% |
|
To consume Ukrainian cultural products (music, films, books, etc.) |
41.3% |
51.2% |
|
To vote in elections |
32.4% |
32.1% |
|
To follow key Ukrainian folk traditions (such as celebrations of Easter and Christams, and ceremonies at weddings, funerals, etc.) |
33.6% |
34.3% |
|
Other |
1.9% |
4.3% |
|
Not sure |
3.2% |
1.6% |
|
Prefer not to answer |
2.6% |
2.8% |
More than two — thirds of respondents declare that they feel patriotic attachment, while among respondents abroad the level of attachment is slightly lower. The highest level of attachment is to the Ukrainian nation (89.2% in Ukraine and 82.4% abroad) and Ukraine (88.4% in Ukraine and 76.1% abroad). The level of attachment at the regional level is slightly lower: 78.8% of respondents in Ukraine and 66.9% of respondents abroad feel attached to their place of residence, while 77.3% of respondents in Ukraine and 68.4% of respondents abroad feel attached to their region.
Women are slightly more likely than men to declare their attachment at all levels. The largest difference is observed at the settlement level, where 83.3% of women and 73.2% of men indicated their attachment. Similar differences are observed at the regional level (81.4% among women and 72.4% among men) and in Ukraine as a whole (92.4% among women and 83.4% among men). Women are also more likely to declare a higher level of attachment: 70.2% of women and 60.9% of men chose the option “very attached” to the Ukrainian nation, 67.5% of women and 55.9% of men to Ukraine, 43.1% of women and 30.7% of men to their region, and 44.7% of women and 32.6% of men to their place of residence.
We took notice that respondents with disabilities are slightly more likely to declare attachment to their place of residence — 48.4% are very attached compared to 38.4% of respondents without disabilities, and another 37.8% are quite attached (without disabilities — 40.2%). Respondents who had at least one of the war experiences asked about also slightly more often indicate that they are very attached to the Ukrainian nation compared to respondents without such experience (70% and 57%, respectively).
|
How attached do you feel to: |
Your settlement |
Your region |
Ukraine |
Ukrainian nation |
||||
|
Ukraine |
Abroad |
Ukraine |
Abroad |
Ukraine |
Abroad |
Ukraine |
Abroad |
|
|
Strongly attached |
39.2% |
32.4% |
37.5% |
34.3% |
62.3% |
43.8% |
66% |
49.9% |
|
Rather attached |
39.6% |
34.5% |
39.8% |
34.1% |
26.1% |
32.3% |
23.2% |
32.5% |
|
Little attached |
10.4% |
18.3% |
11.6% |
18.4% |
5.4% |
15% |
3.7% |
8.1% |
|
Not attached at all |
5.5% |
12% |
5.5% |
10.3% |
2.9% |
7.9% |
2.5% |
7.3% |
|
Not sure |
4.4% |
2% |
4.3% |
2.9% |
2.4% |
1% |
3.0% |
2% |
|
Prefer not to answer |
0.9% |
0.8% |
1.4% |
— |
1% |
— |
1.6% |
0.2% |
In terms of social distance, respondents are generally quite open to diversity across most of the groups surveyed, with the exception of gays and lesbians: almost a quarter of respondents in Ukraine (23.9%) and 14.2% of respondents abroad would not want to live next door to them. Also, 8.1% of respondents in Ukraine would not want to live next to people who speak a different language. Less than 4% of respondents said they would not want to live next door to people from all other categories. At the same time, the majority of respondents do not agree to tolerate coexistence with people who recurrently use alcohol or drugs (75.6% and 79.8%, respectively). Respondents abroad tolerate such behavior even less (81.7% and 89.7%, respectively). A slightly higher share of respondents abroad would not want to live next door to military personnel or their families — 10.5% (the question did not specify which country was meant — the country of current residence or Ukraine). We did not find any significant differences by gender, IDP status, disability, or war experience.
|
What groups would you NOT like to live around? SEVERAL ANSWERS POSSIBLE |
Ukraine |
Abroad |
|
People of other race |
3.8% |
6.7% |
|
People of other nationality |
2.4% |
3% |
|
People who recurrently drink alcohol |
75.6% |
81.7% |
|
People who recurrently use drugs |
79.8% |
89.7% |
|
Gays and lesbians |
23.9% |
14.2% |
|
People of other religion |
4.5% |
6.1% |
|
People who speak another language, not your language |
8.1% |
2.8% |
|
Members of the military or their families |
2.3% |
10.5% |
|
Internally displaced persons |
2.3% |
2.4% |
|
People with disabilities |
1.4% |
1.4% |
|
None of the above |
6.2% |
4.6% |
|
Not sure |
4.2% |
1% |
|
Prefer not to answer |
2% |
0.8% |
In addition, more than two — thirds of respondents took at least some action to help others in their community — 85.4% of respondents in Ukraine and 87% of respondents abroad chose at least one action they had taken to help people around them in the past month. Most respondents made donations (51.9% in Ukraine and 55% abroad) and gave away clothing an dother items to those in need (42.7% in Ukraine and 32.9% abroad). A quarter of respondents in Ukraine (28%) and a third of respondents abroad (35.8%) read calls for help on social media and tried to help. Just as often (19.7% in Ukraine and 36.9% abroad), they posted calls to help others on social media. Almost a third of respondents abroad provided advice to others outside their paid work (29.1%).
|
Which of the below listed things related to the provision or receipt of assistance have you done over the past month? Please, mark all options relevant for your experience: SEVERAL ANSWERS POSSIBLE |
Ukraine |
Abroad |
|
Read the requests to help on social media amd tried to help |
28% |
35.8% |
|
Transferred money to charity funds/volunteers, or to the acocunts of requesters |
51.9% |
55% |
|
posted on social media the calls to help other people or organizations |
19.7% |
36.9% |
|
Asked for help from strangers |
3.5% |
4.2% |
|
Posted on social media the calls for help to you or to your family members |
3.1% |
4.1% |
|
Donated goods (cloths, food, equipment) to those who needed it |
42.7% |
32.9% |
|
Consulted others (beyond your paid activities, such as in legal terms, psychologically, to find a job, or do paperwork, etc.) |
12.4% |
29.1% |
|
Helped with repairs or other household needs to your neighbours |
18.7% |
11.4% |
|
Participated in community meetings or in initiatives to improve the conditions (cleaning, greening, furnishing bomb shelters, etc.) |
14.3% |
8.7% |
|
Other |
8.7% |
10.2% |
|
Not sure |
8.3% |
6.5% |
|
Prefer not to answer |
6.2% |
6.5% |
In terms of culture, most respondents said that cultural events, spaces, and initiatives where they live match their interests and values (61.8%). At the same time, almost a third of respondents had trouble answering this question (19.6%). Women are more likely than men to respond positively to cultural events (64.5% and 58.7%, respectively). Here, we do not observe significant differences in terms of education level, war experience, IDP status, disability, or language. We did not ask this question to respondents abroad, as their assessment of the cultural infrastructure in their country of residence is not relevant to our research question.
|
How do you feel the cutlural events (for example, exhibitions, film screenings, meetings with artists, and other events), spaces, and initiatives at the place of your stay meet your cultural interests and values? ONE ANSWER |
|
|
Fully meet |
22.9% |
|
Partly meet |
38.9% |
|
Hardly meet |
8.6% |
|
Not at all meet |
5.0% |
|
Not sure |
19.6% |
|
Prefer not to answer |
5.0% |
Relative Deprivation
In terms of social cohesion, we observe an average level of relative deprivation.
When asked whether they belonged to a group that experienced discrimination in Ukraine, 9% of respondents in Ukraine and 19.3% of respondents abroad answered affirmatively. It is noteworthy that almost a quarter of respondents in Ukraine (17.3%) and 16.7% abroad are undecided. This means that every 10th respondent in Ukraine and every 5th respondent abroad declare that they systematically experience prejudice against themselves based on their membership of a particular social group.
The experience of discrimination differs by gender: men were twice as likely to report discrimination as women (12.6% vs. 6.1%, respectively). At the same time, women are slightly more hesitant: almost a quarter of female respondents chose the option “Not sure” (20.1% compared to 13.9% among men). Respondents with IDP status are also significantly more hesitant: although the level of perceived discrimination among IDPs is in line with the national average (9%), almost a third chose the option “Not sure” (30.6% compared to 15.3% of respondents without IDP status).
|
Can you claim you belong to a group suffering discrimination in Ukraine? |
Ukraine |
Abroad |
|
Yes |
9% |
19.3% |
|
No |
70.3% |
63.3% |
|
Not sure |
17.3% |
16.7% |
|
Prefer not to answer |
3.4% |
0.8% |
Among respondents in Ukraine who answered that they belonged to a group that experiences discrimination, almost half of respondents marked language as the reason (41.5%). Another 16.9% mentioned religion as the reason for discrimination, 15.9% selected the place of residence, and 12.9% claimed it was gender.
The situation is slightly different among respondents abroad: there, language (47.5%), place of residence (27.5%), sexual orientation (20.2%), national or ethnic origin (14.8%), and religion (13.8%) were even more frequently cited as reasons for discrimination in Ukraine.
|
What is the basis for the discrimination of your group? SEVERAL ANSWERS POSSIBLE (For respondents answering YES in the previous question) |
Ukraine (N = 185) |
Abroad (N = 140) |
|
Language |
41.5% |
47.5% |
|
Religion |
16.9% |
13.8% |
|
Place of residence |
15.9% |
27.5% |
|
Gender |
12.9% |
14.7% |
|
Citizenship |
9.8% |
4.2% |
|
Age |
9.3% |
8.4% |
|
Disability |
7.9% |
5.3% |
|
Sexual orientation |
4.8% |
20.2% |
|
National or ethnic identity |
4.5% |
14.8% |
|
Gender identity |
2.2% |
7.4% |
|
Color of skin or race |
2% |
— |
|
Other |
20.2% |
8.5% |
|
Not sure |
5.2% |
— |
|
Prefer not to answer |
6.8% |
4.1% |
In terms of perceptions of equality, 19.4% of respondents in Ukraine believe that they had fewer chances than others to have their rights protected. It is noteworthy that this indicator is higher abroad: here, a quarter of respondents perceive themselves as unequal to their compatriots (25.3%). There is also a gender trend: women are slightly more likely to declare that they feel equal in terms of rights than men (69.6% compared to 61.9% among men).
|
Compared to other people in Ukraine, [before leaving abroad — for the sample from abroad] I used to have enough chances not to have my rights infringed |
Ukraine |
Abroad |
|
Completely agree |
21.7% |
28.1% |
|
Partly agree |
44.4% |
66.1% |
|
Partly disagree |
10.9% |
11.3% |
|
Completely disagree |
8.5% |
14% |
|
Not sure |
11.9% |
7.3% |
|
Prefer not to answer |
2.5% |
1.2% |
Political Dimension
The political dimension of this study covers both institutional and everyday practices of political participation, allowing us to assess the level of citizens' involvement in the political process, their confidence in their ability to influence public policy, and the degree of trust in central and local authorities.
To this end, we analyzed the following groups of indicators:
- interest in political life: respondents' subjective assessment of their own interest in politics as a basic marker of political inclusion;
- awareness of the impact of their own participation: respondents' perception of the significance of their vote in elections, their ability to influence politics, the accessibility of participation in political life, and their sense of representation in the political system;
- experience of political participation: participation in voting at the national and local levels, as well as in forms of participation in policy making — submitting petitions, appeals, participating in hearings, public budgeting, filing complaints, etc.;
- civic participation skills: respondents' assessment of their ability to engage in various forms of political and civic participation as they wish — voting, contacting MPs, writing petitions, participating in protests, etc.;
- institutional trust: level of trust in key state institutions, in particular central government bodies (the President, the Verkhovna Rada, the Cabinet of Ministers), law enforcement agencies (the Armed Forces, the Police), the courts, local authorities, and service institutions (employment centers).
These indicators make it possible to assess the level of political agency of citizens, their actual and potential involvement in decision — making processes, as well as trust in the institutional framework that determines the quality of political cohesion in society.
Interest In Politics and Sense of Political Agency
Overall, we observe a moderately high level of interest in politics among respondents in Ukraine — two — thirds of respondents said they were very interested or somewhat interested in politics (70.5%). Respondents abroad are slightly more interested in politics — 80.3%. Men also declared an interest in politics slightly more often than women (75.1% compared to 66.7% among women).
|
Rate how interested you in politicis, in your opinion |
Ukraine |
Abroad |
|
Very much interested |
23.7% |
29.8% |
|
Rather interested |
46.8% |
50.5% |
|
Rather not interested |
17.4% |
14.1% |
|
Not at all interested |
5.5% |
2.6% |
|
Not sure |
4.2% |
2.3% |
|
Prefer not to answer |
2.4% |
0.6% |
Despite the high level of interest, the sense of political agency, i.e., the ability to influence the political life of the state, is very low. Only 10.9% of respondents in Ukraine and 14.2% of respondents abroad believe that they have the opportunity to participate in Ukrainian politics. It is noteworthy that men feel empowered twice as often as women: 15.1% of men agreed with this statement, compared to 7.4% of women. In addition, most respondents said that the political system itself was to blame for this: only 10.9% of respondents in Ukraine and 10.4% of respondents abroad agreed with the statement that Ukraine's political system allows people like them to influence what the government does.
We also observe a critical level of declared sense of representation in government: only 2.2% of respondents in Ukraine and 1.6% of respondents abroad said that Ukrainian politicians understand people like them. At the same time, only half of respondents believe that their vote in both national and local elections counts: 42.9% in Ukraine and 46.9% abroad for national elections, and 41.9% in Ukraine and 40.9% abroad for local elections. In the context of national elections, we can see differences in the level of education: while 51.3% of respondents with higher education believe that their vote matters, less than a third of respondents with general and specialized secondary education agree with this statement (30.2% and 31.5%, respectively). We did not find significant differences based on IDP status, disability, or war experience.
|
Which of the following statements do you support? SEVERAL ANSWERS POSSIBLE |
Ukraine |
Abroad |
|
I believe that in national elections my voice matters |
42.9% |
46.9% |
|
I believe that in local elections my voice matters |
41.9% |
40.9% |
|
Political system in Ukraine allows such people like me to impact everything the government does |
7.6% |
10.4% |
|
I am certain I have a possibility to participate in Ukrainian politics |
10.9% |
14.2% |
|
Ukrainian politicians understand the people like me |
2.2% |
1.6% |
Actual and Potential Political Participation
We decided to see how willing respondents were to participate in political life in various ways. Since we were unable to test respondents' actual knowledge and skills in civic participation within the scope of this study, we asked them which of the listed actions they felt confident they could take if they wished to. This question covers three dimensions of civic participation:
- whether respondents believe they know how to perform a particular action,
- whether respondents feel confident that they could figure out how to perform a particular action if necessary,
- whether they feel they would dare to perform a particular action.
Overall, respondents report an average level of potential political participation, with respondents abroad reporting a slightly higher level of potential participation than respondents in Ukraine.
Most respondents expressed confidence that they would be able to vote in local or national elections — 48.1% in Ukraine and 56.9% abroad. About one — third of respondents in both Ukraine and abroad said they would be able to report a problem related to public amenities (34.7% and 37.7%, respectively). Slightly less than a third of respondents in Ukraine (30.7%) said they would be able to participate in a rally, demonstration, peaceful protest, etc. In contrast, half of respondents abroad declared their confidence in attending a rally or demonstration (49.7%). Less than a third of respondents in Ukraine said they were confident they could participate in all other forms of civic and political participation. Almost a quarter of respondents in Ukraine (22.9%) said that they found it difficult to answer that question, which may indicate the low relevance of public and political discourse in their environment and a low level of civic education. We did not find any significant differences by gender, war experience, disability, or IDP status.
In contrast, about a third of respondents abroad said they felt confident about submitting a petition to the President or the Cabinet (35.9%), creating or joining a civil society organization (31.7%), and complaining about being asked for a bribe (29.2%). Another quarter indicated their confidence in participating in public hearings or meetings (23.7%). 15.6% of respondents abroad were unable to answer this question.
|
Which of the following things are you sure you could do if you wanted to? SEVERAL ANSWERS POSSIBLE |
Ukraine |
Abroad |
|
To vote in local or national elections in Ukraine |
48.1% |
56.9% |
|
To reach out to an MP of the Verkhovna Rada |
13.2% |
16.5% |
|
To submit an e — petition to the President or to the Cabinet of Ministers of Ukraine |
21.3% |
35.9% |
|
To participate in public hearings or meetings |
17.1% |
23.7% |
|
To create or to join an NGO |
19.7% |
31.7% |
|
To make a request to access public information |
17.1% |
23.8% |
|
To complain about the demand for a bribe coming from a public servant, a law — enforcement officer, a teacher or a school principal, a health care professional, etc. |
21.8% |
29.2% |
|
To submit a request or a complaint to the specialized ombudsmen (human rights ombudsman, educational ombudsman, language ombudsman, etc.) |
14.8% |
23.2% |
|
To report a problem with public amenities (such as potholes on roads, faulty street lighting, lacking trashcans, etc.) |
34.7% |
37.7% |
|
To participate in the deliberations or discussions of a public budget |
16.1% |
15.6% |
|
To participate in a rally, demonstration, peaceful protest, etc. |
30.7% |
49.7% |
|
Not sure |
22.9% |
15.6% |
|
Prefer not to answer |
9.5% |
6.1% |
At the same time, the level of actual civic and political participation is significantly lower than its potential, except for participation in elections. 61.5% of respondents in Ukraine and 51.3% abroad have always participated in national elections, while in local elections it was 55.9% among respondents in Ukraine and 46.7% abroad. Another quarter of respondents in both Ukraine and abroad usually participated in both national and local elections.
|
How often have you participated in national elections (presidential, parliamentary) in Ukraine? |
Ukraine |
Abroad |
|
Always participated |
61.5% |
51.3% |
|
Usually participated |
23.1% |
24.8% |
|
Usually did not participate |
3.3% |
4.4% |
|
Never participated |
6.8% |
12.8% |
|
I have no right to vote |
0.4% |
2% |
|
Not sure |
2% |
3.1% |
|
Prefer not to answer |
2.9% |
1.6% |
|
How often have you participated in local elections in Ukraine? |
Ukraine |
Abroad |
|
Always participated |
55.9% |
46.7% |
|
Usually participated |
23.7% |
23.5% |
|
Usually did not participate |
5.1% |
5.1% |
|
Never participated |
9.3% |
17.3% |
|
I have no right to vote |
0.5% |
2.8% |
|
Not sure |
2.4% |
3.1% |
|
Prefer not to answer |
3.2% |
1.6% |
With regard to other types of civic and political participation, almost half of respondents did not engage in any of the listed activities. We did not find any significant differences depending on gender, age, disability, or IDP status. The largest share of respondents in Ukraine over the past year have reported problems with public amenities (16.2%), participated in rallies (7.5%) and public hearings or meetings (7.2%), and submitted petitions to the President or the Cabinet of Ministers (6.9%). Respondents who had some of the war experiences listed were more likely to attend rallies and demonstrations than respondents with no such experience (9.8% and 2.4%, respectively). At the same time, respondents abroad participated in rallies and demonstrations significantly more often than respondents in Ukraine — a quarter of respondents abroad (24.2%) marked this activity, compared to 7.5% in Ukraine.
|
There are different ways to improve life in Ukraine or to prevent the deterioration of situation. Over the past year, which of the below have you been doing? SEVERAL ANSWERS POSSIBLE |
Ukraine |
Abroad |
|
Reached out to an MP of the Verkhovna Rada |
1.4% |
1.4% |
|
Submitted a petition to the President or the Cabinet of Ministers of Ukraine |
6.9% |
9.1% |
|
Submitted a petition to a local council |
2.7% |
2.6% |
|
Participated in public hearings or meetings |
7.2% |
2.6% |
|
Created or joined an NGO |
4.5% |
6.5% |
|
Made a request to access public information |
3.3% |
3.8% |
|
Complained about the demand for a bribe coming from a public servant, a law — enforcement officer, a teacher or a school principal, a health care professional, etc. |
1.8% |
2% |
|
Submitted a request or a complaint to the specialized ombudsmen (human rights ombudsman, educational ombudsman, language ombudsman, etc.) |
2.3% |
3.3% |
|
Reported a problem with public amenities (such as potholes on roads, faulty street lighting, lacking trashcans, etc.) |
16.2% |
4.2% |
|
Participated in a deliberation, discussion of a public budget |
3.1% |
0.6% |
|
Participated in a rally, demonstration, peaceful protest, etc. |
7.5% |
24.2% |
|
None |
43.9% |
50.1% |
|
Not sure |
15.4% |
7.3% |
|
Prefer not to answer |
7.6% |
5.7% |
|
EDUCATIONAL BACKGROUND |
||||||
|
Incomplete secondary |
General secondary |
Secondary specialized |
Higher |
Cramer's V |
p |
|
|
Always partcipated |
43.5 |
39.5 |
55.2 |
59.6 |
0.122 |
<.001 |
|
Usually participated |
17.4 |
21.5 |
24.8 |
23.8 |
||
|
Usually did not participate |
0 |
5.2 |
5.9 |
4.8 |
||
|
Never participatedі |
13 |
21.9 |
7.5 |
7.5 |
||
|
I have no right to vote |
4.3 |
0.9 |
0 |
0.6 |
||
|
Not sure |
17.4 |
5.6 |
2.3 |
1.7 |
||
|
Prefer not to answer |
4.3 |
5.6 |
4.2 |
2.2 |
||
Vertical Trust Index: Central and Local Authorities
To better understand how much citizens trust key institutions of power, we calculated the Vertical Trust Index. This index reflects the level of trust in institutions representing the “vertical of power” — in particular, the courts, parliament, the president, the government, the police, and local authorities. In the context of trust, we are not talking only about declarative approval or disapproval of actions, but about the general sense of justice, transparency, accountability, and security that these institutions inspire in citizens.
The scale consists of eight statements that measure the level of trust in different branches of government. Respondents rated their agreement with each statement on a scale from “strongly agree” to “strongly disagree.” This approach allows for a comprehensive assessment not of individual institutions, but of the overall level of institutional trust — the extent to which people feel that government bodies act honestly, take citizens into account, and ensure their well — being. We asked respondents how much they trust the following institutions:
- courts;
- National Police of Ukraine;
- Armed Forces of Ukraine;
- Verkhovna Rada of Ukraine;
- the President of Ukraine;
- the Cabinet of Ministers of Ukraine;
- local authorities;
- employment centers (although they are not government institutions, given the critical importance of this institution in the context of increased mobility and vulnerability of citizens due to the full — scale war and high unemployment, we included these institutions in the trust index).
The index has high statistical reliability (Cronbach's alpha = 0.85), indicating that all eight items form a coherent, consistent scale. This allows the index to be used to compare different social groups — for example, by IDP status, gender, or war experience.
On a scale of 0 to 10, the average score is 5.3 and the median is 5.4, indicating an average, potentially situational level of trust in institutions among most respondents. The distribution of values on the Vertical Trust Index is close to symmetrical, indicating a broader spectrum of views — from complete distrust to moderate or high trust. This contrasts with the Social Inclusion Index, where most respondents agreed with the statements but did so less consistently, concentrating mainly at the lower end of the scale. Thus, although respondents more often agreed with positive statements about their social inclusion, this index has a below — average value due to the weak differentiation of responses. In contrast, the Vertical Trust Index, despite critical assessments of individual institutions, recorded a higher average score thanks to a more structured and varied response profile.
These results are consistent with responses to individual questions:
- only 2–5% of respondents fully trust the courts, government, or parliament;
- 20–30% tend to trust them;
- over 60% express distrust.
A slightly higher level of trust is observed in the President of Ukraine (58% positive ratings) and local authorities.
Overall, the Vertical Trust Index shows a structural deficit of trust in state institutions, which has important policy implications: effective governance, transparency, and accountability must be a priority in order not only to preserve symbolic unity but also to restore real, everyday trust in the state among citizens.
Answers of Respondents to Each Statement On the Scale
We asked respondents, “How much do you trust each of the following institutions?”
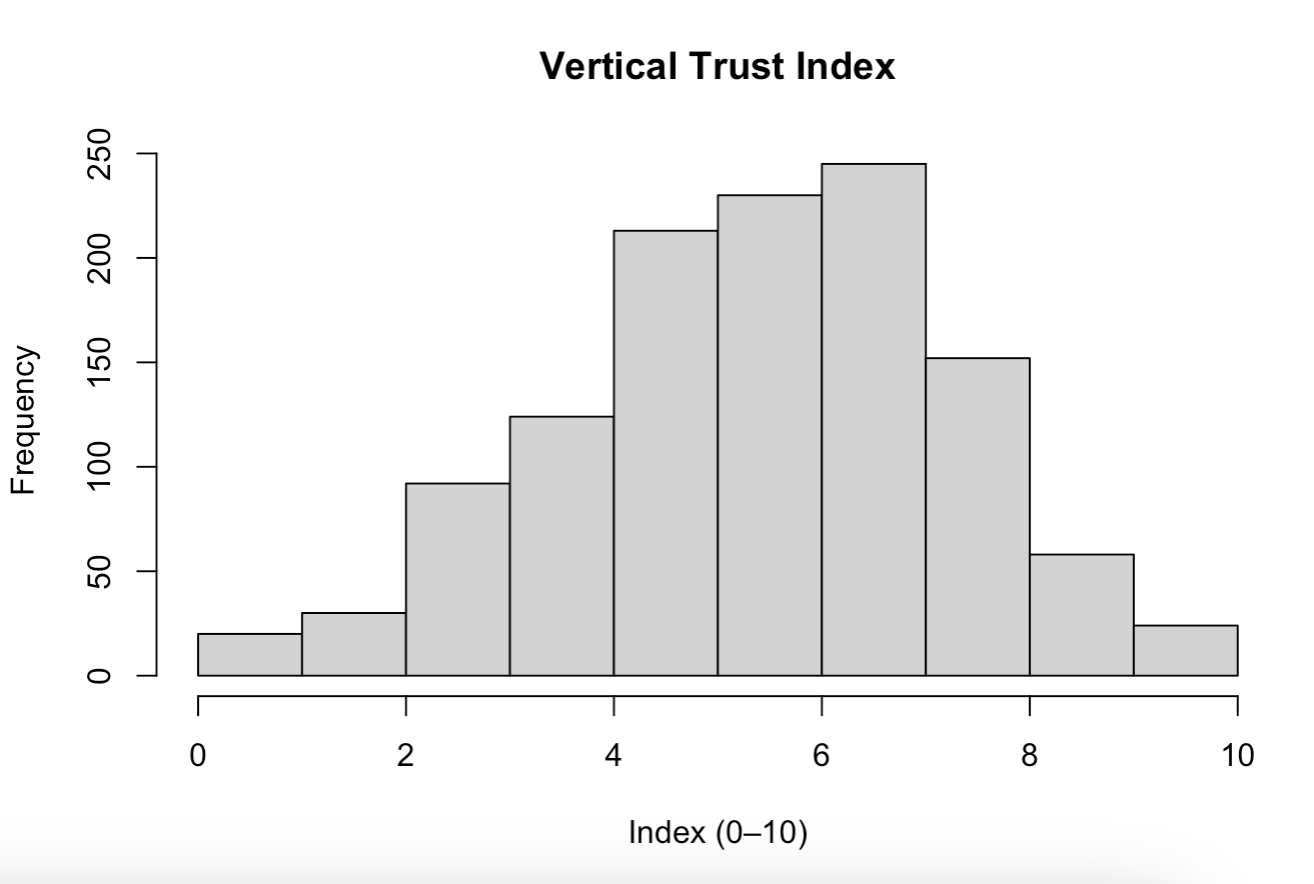
One of the lowest levels of trust among respondents was in the courts. Only 2.8% of respondents in Ukraine and 0.2% abroad chose the option “completely trust.” About one — fifth of respondents also tend to trust the courts — 19.3% in Ukraine and 12.2% abroad. In the context of trust in the courts, women were slightly more hesitant than men: 16.2% of women chose the option “Not sure” compared to 9.9% of men. It is noteworthy that IDP respondents trust the courts slightly more than respondents without IDP status, although the level of trust is still low (29.8% and 20.9%, respectively). Respondents who have had at least one of the war experiences mentioned in the survey are also slightly more likely to trust completely or rather trust than those who have not had any of these experiences (23.7% vs. 18.3%, respectively).
|
Courts |
Ukraine |
Abroad |
|
Completely trust |
2.8% |
0.2% |
|
Rather trust |
19.3% |
12.2% |
|
Rather distrust |
33.4% |
35.5% |
|
Completely distrust |
28.1% |
43.9% |
|
Not sure |
13.4% |
7.1% |
|
Prefer not to answer |
3.1% |
1% |
A similar trend can be observed with regard to the Verkhovna Rada of Ukraine: 14.5% of respondents in Ukraine and 14% abroad trust the parliament, while 2.3% in Ukraine and 0.8% abroad chose the option “completely trust.” Women were twice as likely to choose the option “Not sure” than men (15.4% vs. 8.4%, respectively).
|
Verkhovna Rada of Ukraine |
Ukraine |
Abroad |
|
Completely trust |
2.3% |
0.8% |
|
Rather trust |
15.2% |
13.2% |
|
Rather distrust |
31.5% |
32.7% |
|
Completely distrust |
35.6% |
45.1% |
|
Not sure |
12.2% |
6.7% |
|
Prefer not to answer |
3.1% |
1.4% |
In terms of trust, the situation is somewhat better for the Cabinet of Ministers of Ukraine: a quarter of respondents in Ukraine (24.3%) expressed trust in the Cabinet, and slightly fewer abroad — 20.5%. Women were more likely to say that they were not sure how to answer this question — 17.9% of female respondents compared to 9.4% of male respondents. We did not find any significant differences among other groups of respondents.
|
Cabinet of Ministers of Ukraine |
Ukraine |
Abroad |
|
Completely trust |
2.7% |
1.6% |
|
Rather trust |
21.6% |
18.9% |
|
Rather distrust |
30.2% |
29% |
|
Completely distrust |
27.9% |
38.3% |
|
Not sure |
14.1% |
10.4% |
|
Prefer not to answer |
3.4% |
1.8% |
About one — third of respondents say they trust the National Police (37.4% in Ukraine and 31.6% abroad), but the results for the option “completely trust” are also very low (5.5% in Ukraine and 2.8% abroad). Here, too, there is a tendency for women to be more hesitant in their attitudes than men: 14.3% of women chose “Not sure” compared to 7.2% of men. Respondents with at least one of the war experiences asked about also trust the police more than respondents without such experience (40.2% and 31%, respectively).
|
National Police of Ukraine |
Ukraine |
Abroad |
|
Completely trust |
5.5% |
2.8% |
|
Rather trust |
31.9% |
28.8% |
|
Rather distrust |
27.6% |
34.7% |
|
Completely distrust |
20.7% |
24.9% |
|
Not sure |
11.1% |
7.4% |
|
Prefer not to answer |
3.1% |
1.4% |
Local authorities are trusted by 33.4% of respondents in Ukraine. At the same time, skepticism among respondents abroad is slightly higher: 25% of them trust local authorities. Respondents abroad are also less inclined to doubt their attitude: among them, 5.7% chose the “Not sure” option, while among respondents in Ukraine, this figure is twice as high (10.7%). Respondents who have had at least one of the war experiences mentioned in the survey are also slightly more likely to declare their trust in local authorities — 34.6% compared to 30.7% among respondents without such experiences. We do not observe any significant differences among other groups of respondents.
|
Local authorities |
Ukraine |
Abroad |
|
Completely trust |
4.3% |
3.1% |
|
Rather trust |
29.1% |
21.9% |
|
Rather distrust |
30.9% |
38.5% |
|
Completely distrust |
22% |
29.6% |
|
Not sure |
10.7% |
5.7% |
|
Prefer not to answer |
3% |
1.2% |
Trust in the President of Ukraine remains quite high. Overall, 58% of respondents in Ukraine said they trust the President, with a quarter (25.5%) saying they “completely trust” him. The situation is similar among respondents abroad (56%). Women declare their trust in the President slightly more often than men (62.6% compared to 52.5% among men). Respondents who had at least one of the war experiences mentioned in the survey also said their trust in the President more often: 62.6% compared to 50% among respondents without such experience.
|
President of Ukraine |
Ukraine |
Abroad |
|
Completely trust |
25.5% |
19.7% |
|
Rather trust |
32.5% |
36.3% |
|
Rather distrust |
13% |
12.4% |
|
Completely distrust |
15.8% |
23.3% |
|
Not sure |
8.9% |
6.9% |
|
Prefer not to answer |
4.3% |
1.4% |
The Ukrainian Armed Forces, which include the Armed Forces of Ukraine and other formations and bodies responsible for ensuring the defense of the state, enjoy the highest levels of trust. More than half of respondents in Ukraine (54.3%) and almost half abroad (46.6%) fully trust the Defense Forces, and overall, the level of trust reaches more than two — thirds of respondents both in Ukraine and abroad (84.5% and 84.2%, respectively). We do not observe any significant differences among different groups of respondents, except for those who have at least one of the war experiences mentioned in the survey: among them, almost 90% of respondents trust the Defense Forces.
|
Defense Forces of Ukraine |
Ukraine |
Abroad |
|
Completely trust |
54.3% |
46.6% |
|
Rather trust |
30.2% |
37.6% |
|
Rather distrust |
3.8% |
5% |
|
Completely distrust |
2.7% |
5.1% |
|
Not sure |
6.2% |
4.3% |
|
Prefer not to answer |
2.9% |
1.5% |
We also decided to find out the level of trust in employment centers, given the importance of this institution in the context of high population mobility due to the war, as well as the unstable situation on the labor market and unemployment at the level of one — fifth of citizens (12.1%). Overall, employment centers are trusted by exactly 50% of respondents in Ukraine and 39% abroad. However, the highest level of trust (“completely trust”) was chosen by less than 10% of respondents in Ukraine and half as many (4.7%) abroad. The share of those who are undecided in their attitude reaches almost a quarter of respondents (21.8% in Ukraine and 18.8% abroad). At the same time, respondents who have the requested war experience are more likely to trust employment centers — 54% compared to 40.5% without such experience.
|
Employment centers |
Ukraine |
Abroad |
|
Completely trust |
8.5% |
4.7% |
|
Rather trust |
41.5% |
34.3% |
|
Rather distrust |
16% |
23.8% |
|
Completely distrust |
7.6% |
15.8% |
|
Not sure |
21.8% |
18.8% |
|
Prefer not to answer |
4.7% |
2.6% |
Media Dimension
The media dimension in this study allows us to assess respondents' experience of representation in public discourse, their level of trust in the news, and their subjective perception of the media as an inclusive or exclusive environment. Particular attention is paid to assessing the extent to which respondents see themselves, their experiences, and their environment in the information field, whether they perceive this representation as accurate and fair, and whether they consider it possible to express themselves publicly.
To this end, we analyzed the following groups of indicators:
- main sources of information: types of platforms from which respondents most often obtain news about the situation in Ukraine and the world — television, online media, social networks, local media, news channels in messengers, private circle;
- level of trust in the media: a generalized assessment of the extent to which respondents trust most of the news they consume — as a basic assessment of the reliability of the information environment;
- Perception of attention to one's social group: whether respondents believe that Ukrainian news pays sufficient attention to their political views, age, gender, profession, ethnic origin, place of residence, or experience similar to theirs;
- assessment of media objectivity in reporting: whether respondents consider news to be objective with regard to the social identities to which they belong or their life experience;
- assessment of the level of representation in the media: the frequency with which respondents see people with similar experiences in the media and the extent to which they would like to see more “people like me” in the news;
- perceived bias in coverage: the frequency of biased narratives about people with similar experiences, according to respondents, as well as an assessment of the overall likelihood that Ukrainian media will provide fair coverage of all categories of society in the future;
- confidence in the right to public expression: assessment of personal experience of refraining from public expression due to fear of condemnation or misunderstanding — as an indicator of the sense of safety in participating in public discourse.
This dimension allows assessing the extent to which the information environment in Ukraine is open, fair, and inclusive, as well as identifying the level of “media inclusion” of different social groups — both in terms of their presence and in terms of the perception of this presence as correct, relevant, and safe.
Sources of News Consumption And Trust In Them
We observe some differences in media consumption between respondents in Ukraine and respondents abroad. The most popular source of news for respondents in Ukraine is channels and pages of Ukrainian media on social networks and messengers (46.7%), while among respondents abroad, news channels and pages on social networks and social media, i.e., news aggregators, prevail (53.5%). The latter are the second most popular source of news for respondents in Ukraine (40%). Another third of respondents in both Ukraine and abroad read, listen to, and watch bloggers on social media and messengers (30.4% in Ukraine and 31.9% abroad).
Among respondents in Ukraine, less than a quarter consume news from Ukrainian television (19.9%), from relatives, friends, neighbors, etc. (17.5%), and from Ukrainian national online media (16%).
Among respondents abroad, the second most popular source is Ukrainian media channels and pages on social networks and messengers. International media is also quite popular, read by a third of respondents abroad (31.2%). Significantly more respondents abroad than in Ukraine receive news from relatives, friends, and others (34.3%) and read national online media (24.8%) more often.
We found significant differences in media consumption between men and women only in the case of bloggers on social media and messengers: men receive news from them slightly more often than women (35.6% vs. 26.1%). In terms of education, bloggers are slightly more popular among respondents with higher education: they are read, watched, and listened to by one — third of respondents with higher education (34.3%) and one — quarter of those with general and specialized secondary education (24.1% and 26%, respectively). We did not find any significant differences among other groups of respondents.
|
What sources do you usually use to get the news updated about the situation in Ukraine and in the world? MAX THREE ANSWERS |
Ukraine |
Abroad |
|
Ukranian national television |
19.9% |
5.3% |
|
Ukranian national online media |
16.0% |
24.8% |
|
Ukranian national printed media |
1.5% |
1.6% |
|
Ukranian national radio stations |
5.9% |
1.6% |
|
International media |
— |
31.2% |
|
National or local media of my countries of residence |
— |
9.0% |
|
Bloggers in social media and messengers |
30.4% |
31.9% |
|
Channels and pages of Ukrainian media on social networks and messengers |
46.7% |
46.7% |
|
News channels and pages in social media and messengers |
40.0% |
53.5% |
|
Family, friends, neighbours, work colleagues, acquaintances |
17.5% |
34.3% |
|
Ukrainian local television |
6.1% |
— |
|
Ukrainian local online media |
7.1% |
— |
|
Ukrainian local printed media |
1.1% |
— |
|
Ukrainian local radio |
2.4% |
— |
|
Other |
5.8% |
4.3% |
|
Not sure |
2.0% |
0.4% |
|
Prefer not to answer |
2.4% |
1.0% |
In terms of trust in selected sources, respondents in Ukraine and abroad were divided in half. Among respondents in Ukraine, 49.4% said they could trust most of the news they consume, with only 6.4% completely confident in this. Among respondents abroad, the level of trust is slightly higher, with 58.8% of respondents believing that they can consume most Ukrainian news. Another fifth of respondents in Ukraine are undecided on this issue (14.6%), while abroad only 6.7% of respondents chose “Not sure.”
The level of trust in the Ukrainian news they consume is the same among men and women (49.8% and 49%), while women were slightly more likely to choose the “Not sure” option — 17.2% compared to 11.4% among men. We also observe some differences in terms of education level: respondents with higher education were the least likely to say that they completely trust most news — 3.8% compared to 9.6% among respondents with secondary specialized education and 11.2%.
|
Rate how strongly you support the following statement: I believe that the Ukrainian news I consume can generally be trusted. ON ANSWER |
Ukraine |
Abroad |
|
Completely agree |
6.4% |
9.8% |
|
Rather agree |
43.0% |
47.0% |
|
Rather disagree |
22.2% |
20.1% |
|
Completely disagree |
11.4% |
16.0% |
|
Not sure |
14.6% |
6.7% |
|
Prefer not to answer |
2.5% |
0.4% |
Sense of Representation In the Media
Overall, respondents, both in Ukraine and abroad, feel that they are underrepresented in the media. First, we asked respondents whether they felt that different aspects of their experience and identity were given enough attention in the Ukrainian media. Most respondents had doubts about which of the aspects we asked about were given enough attention in Ukrainian news: 57% of respondents in Ukraine and 58.5% of respondents abroad chose the option “Not sure.” Among the aspects asked about, respondents most often answered that their political views were adequately represented in the media — this option was chosen by 20.4% of respondents in Ukraine and 19.7% abroad. Also, slightly less than a fifth of respondents abroad noted that the Ukrainian media pays enough attention to experiences of war similar to theirs, as well as to people who face similar problems. These options were also more popular than others among respondents in Ukraine: 7.3% of respondents mentioned their experience of living through war, and 7.7% mentioned people facing similar problems.
|
As regards the news from Ukraine in general, in your opinion, which of the following aspects has been sufficiently covered by the media? SEVERAL ANSWERS POSSIBLE |
Ukraine |
Abroad |
|
Your political views |
20.4% |
19.7% |
|
People of your age |
5.9% |
5.5% |
|
People of your gender |
2.1% |
4.3% |
|
Your social and economic class |
5.7% |
4.5% |
|
People of your profession |
3.5% |
0.6% |
|
People of your ethnic affiliation |
3.2% |
5.9% |
|
The place where you live |
6.1% |
4.5% |
|
The experience of living through the war similar to yours |
7.3% |
10.8% |
|
People who face the challenges similar to yours |
7.7% |
11.2% |
|
Not sure |
57.0% |
58.5% |
|
Prefer not to answer |
7.7% |
7.3% |
We observe the same trend in the context of perceptions of objectivity in the coverage of various aspects of personality and experience. Similarly, more than half of respondents chose the option “Not sure” — 58.1% of respondents in Ukraine and 59.7% of respondents abroad. The top three in terms of perceived objectivity of coverage were political views (17.3% in Ukraine and 15.1% abroad), experience of living through war (7.2% in Ukraine and 13.5% abroad), and problems faced by respondents (8.1% in Ukraine and 9.7% abroad).
|
As regards news in Ukraine in general, do you believe the topics listed below ae covered objectively? SEVERAL ANSWERS POSSIBLE |
Ukraine |
Abroad |
|
Your political views |
17.3% |
15.1% |
|
People of your age |
4.9% |
3.9% |
|
People of your gender |
1.5% |
2.5% |
|
Your social and economic class |
5.7% |
6.5% |
|
People of your profession |
3.4% |
1.6% |
|
People of your ethnic affiliation |
2.4% |
4.3% |
|
The place where you live |
6.3% |
4.9% |
|
The experience of living through the war similar to yours |
7.2% |
13.5% |
|
People who face the challenges similar to yours |
8.1% |
9.7% |
|
Not sure |
58.1% |
59.7% |
|
Prefer not to answer |
8.0% |
8.3% |
At the same time, almost half of respondents said they would like to see more people like themselves in the news — 42.2% of respondents in Ukraine and 45.8% abroad. 28.3% of respondents in Ukraine and 29% abroad were unable to give a clear answer to this question. It is noteworthy that men were slightly more likely than women to express a desire to see more people like themselves in the news (46% and 39%, respectively).
|
Rate how much you agree with the following statement: I would like to see more people like myself in the news. / I would like to see more people like me in the UKRAINIAN NEWS. ONE ANSWER |
Ukraine |
Abroad |
|
Completely agree |
12.0% |
17.8% |
|
Partly agree |
30.2% |
28% |
|
Partly disagree |
9.2% |
7.5% |
|
Completely disagree |
9.5% |
9.9% |
|
Not sure |
28.3% |
29% |
|
Prefer not to answer |
10.9% |
7.7% |
The largest share of respondents indicated that they only sometimes see people in the news whose experiences are similar to theirs — 31.3% of respondents in Ukraine and 29% abroad. Another quarter of respondents in Ukraine and almost a third abroad see people like themselves rarely or very rarely in the news (25.1% and 29.4%). Less than a quarter of respondents said they see similar experiences in the news often or very often (17.6% of respondents in Ukraine and 15.2% abroad).
|
Rate how often you see or hear news about people with the experience similar to yours? / Rate how often you see or hear Ukrainian news about people with the experience similar to yours? ONE ANSWER |
Ukraine |
Abroad |
|
Very often |
5.5% |
3.2% |
|
Often |
12.1% |
13% |
|
Sometimes |
31.3% |
29% |
|
Seldom |
15% |
16.8% |
|
Very seldom |
10.1% |
12.6% |
|
Never |
7.9% |
15.0% |
|
Not sure |
13.1% |
7.7% |
|
Prefer not to answer |
4.9% |
2.7% |
At the same time, half of respondents said that it was difficult for them to say whether experiences similar to theirs were covered objectively in the news (43.1% in Ukraine and 38.4% abroad). Less than a third said that their experience was covered objectively in the news (32.4% in Ukraine and 31.3% abroad).
|
Rate how objective is the coverage of news about people with the experience similar to yours? ONE ANSWER |
Ukraine |
Abroad |
|
Very objective |
3.5% |
1.8% |
|
Rather objective |
28.9% |
29.5% |
|
Rather non — objective |
11.6% |
14.7% |
|
Very non — objective |
4.3% |
10.3% |
|
Not sure |
43.1% |
38.4% |
|
Prefer not to answer |
8.7% |
5.3% |
Interestingly, when the question was phrased differently — how often respondents encountered biased coverage of people with experiences similar to theirs — significantly fewer respondents hesitated with their answers: a quarter of respondents in both Ukraine and abroad chose “Not sure” (28.5% and 23.9%, respectively). Frequent and very frequent bias in the media was observed by 16.9% of respondents, with a quarter of respondents in both Ukraine and abroad choosing the option “sometimes” (26.8% and 26.4%, respectively).
Men answered that they often saw or heard biased coverage similar to their own experience slightly more often than women: 19.7% compared to 14.5% among women. The situation is similar among respondents who have at least one of the war experiences asked about: they reported seeing biased coverage of experiences similar to their own frequently or very frequently slightly more often than respondents without any of the war experiences asked about (18.8% and 12.3%, respectively).
|
In your opinion, how often the news you see or hear show the biased coverage of people with experience similar to yours? / In your opinion, how often the Ukrainian news you see or hear show the biased coverage of people with experience similar to yours? ONE ANSWER |
Ukraine |
Abroad |
|
Very often |
4.8% |
9.7% |
|
Often |
12.1% |
15.8% |
|
Sometimes |
26.8% |
26.4% |
|
Seldom |
7.8% |
6.5% |
|
Very seldom |
5.9% |
5.9% |
|
Never |
5.4% |
7.7% |
|
Not sure |
28.5% |
23.9% |
|
Prefer not to answer |
8.7% |
4.1% |
In terms of fairness and balance in the coverage of all categories of society, only 1% of respondents both in Ukraine and abroad said that all categories of society are already covered fairly. More than a quarter of respondents in Ukraine (28.7%) and almost a third of respondents abroad (33.2%) expressed optimism that the situation with fair coverage of different categories of society is likely to improve in the future. More pessimistic responses to this question were given by half of respondents both in Ukraine and abroad (50.1% and 48.2%, respectively). A fairly categorical response that it is impossible to ensure balanced and fair coverage of all categories of society was given by 10.4% of respondents in Ukraine and 14% of respondents abroad.
|
During your life, how probable do you think it is that the media would provide a fair and balanced coverage of all categories of society? / During your life, how probable do you think it is that the Ukrainian media would provide a fair and balanced coverage of all categories of society? ONE ANSWER |
Ukraine |
Abroad |
|
Very probable |
5.5% |
5.3% |
|
Rather probable |
23.2% |
27.9% |
|
Not very probable |
39.7% |
34.2% |
|
Impossible |
10.4% |
14% |
|
All categories of society are already covered in a fair way |
0.9% |
1% |
|
Not sure |
16.4% |
14.6% |
|
Prefer not to answer |
3.9% |
3.1% |
Almost a third of respondents in Ukraine (30.3%) and almost half abroad (46.9%) tend to self — censor due to fear of condemnation or misunderstanding from those around them. Respondents in Ukraine were twice as likely to choose the option “Not sure” (12.5%) than respondents abroad (6.5%). We did not find any significant differences in the responses of different groups of respondents.
|
Over the past six months, have you ever felt like expressing yourself in public (e.g., on social media or in mass media) but never did it for fear of judgement or misunderstanding? ONE ANSWER |
Ukraine |
Abroad |
|
Yes |
30.3% |
46.9% |
|
No |
51.2% |
43.9% |
|
Not sure |
12.5% |
6.5% |
|
Prefer not to answer |
5.9% |
2.6% |