We have already mentioned about non-conformity of voting results in prisons and colonies to nationwide and regional results in the articles covering 2014 presidential elections. Polling stations in penitentiary institutions are the best example of non-free voting. In this article, we'll analyze the results of Parliamentary elections in correlation between prison and freedom. We used the data from the website of the CEC, available on 29 October in the evening. Incomplete sampling is not going to influence our conclusions and standpoint: "penitentiary institutions widely use administrative resources and compulsion to influence the voting process".
As of 29 October at 11:00 PM, electronic protocols of the DEC gathered from 182 single-member districts were fully processed. 16 districts: 13, 16, 49, 58, 59, 66, 96, 106, 112, 113, 114, 132, 137, 138, 140, 165, 182 and 199 were partly processed. We included the processed data into calculations. However, we didn't include the results of overseas election district. The data is available for 75-99% of polling stations in some of the abovementioned districts The programming language R was used for analytical processing. To collect data according to key indicators, we used the plyr package of the programming language R. The sampling includes voting results from 27,841 regular polling stations and 1,133 special. Special polls include 972 located in medical and rehabilitation centers, 156 in penitentiary institutions, and 5 military polling stations: guard houses, disciplinary battalions, and military hospitals (only those having a number of military departments). According to the register of voters, 30,654,294 persons were included into the register. 29,835,861 in the voter list, and 818,433 in the extract from the list. The total number of voters according to the type of polling station is presented in the table 1.
Table 1 — Total number of voters at different types of polls
|
Type of a polling station |
Total number of voters |
|
regular |
30,465,395 |
|
medical |
115,329 |
|
military |
841 |
|
penitentiary |
72,729 |
The relative number of voters in penitentiary institutions is 0.24% of the total number of voters in Ukraine. Table 2 shows the number of voters at different types of polls in every Ukrainian oblast.
Table 2 — Total number of voters at different types of polls in Ukrainian oblasts and Kyiv city
|
Oblast |
Regular |
Medical |
Military |
Penitentiary |
Percentage of voters in penitentiary polling stations |
|
Vinnytsia |
1,002,719 |
4,453 |
0 |
3,014 |
0.30 |
|
Volyn |
797,207 |
3,613 |
99 |
1,053 |
0.13 |
|
Dnipropetrovsk |
2,652,171 |
19,995 |
0 |
9,254 |
0.35 |
|
Donetsk |
1,309,495 |
3,467 |
0 |
2,656 |
0.20 |
|
Zhytomyr |
973,048 |
4,047 |
80 |
4,107 |
0.42 |
|
Zakarpattia |
965,391 |
2,299 |
0 |
290 |
0.03 |
|
Zaporizhia |
1,454,917 |
3,743 |
0 |
4,886 |
0.33 |
|
Ivano-Frankivsk |
1,097,252 |
3,636 |
0 |
989 |
0.09 |
|
Kyiv |
1,459,280 |
4,575 |
0 |
2,994 |
0.20 |
|
Kirovohrad |
791,999 |
4,163 |
0 |
2,243 |
0.28 |
|
Lviv |
2,007,194 |
8,122 |
644 |
4,030 |
0.20 |
|
Luhansk |
421,283 |
374 |
0 |
533 |
0.13 |
|
Mykolaiv |
914,456 |
2,934 |
0 |
3,663 |
0.40 |
|
Kyiv city |
2,156,577 |
10,882 |
18 |
1,865 |
0.09 |
|
Odesa |
1,789,969 |
6,452 |
0 |
3,693 |
0.21 |
|
Poltava |
1,219,712 |
1,765 |
0 |
3,386 |
0.28 |
|
Rivne |
885,211 |
1,928 |
0 |
2,376 |
0.27 |
|
Sumy |
947,436 |
2,570 |
0 |
2,414 |
0.25 |
|
Ternopil |
874,561 |
2,185 |
0 |
1,161 |
0.13 |
|
Kharkiv |
2,177,554 |
9,103 |
0 |
7,591 |
0.35 |
|
Kherson |
830,068 |
2,200 |
0 |
2,796 |
0.33 |
|
Khmelnytskyi |
1,077,630 |
3,360 |
0 |
2,834 |
0.26 |
|
Cherkasy |
1,046,283 |
4,466 |
0 |
2,524 |
0.24 |
|
Chernivtsi |
715,661 |
1,717 |
0 |
920 |
0.13 |
|
Chernihiv |
898,321 |
3,280 |
0 |
1,457 |
0.16 |
To compare the voting results, we selected six leading parties and divided polling stations into "penitentiary" and "free". Parties which overcame the 5% threshold were considered as leading parties: the People's Front, the Petro Poroshenko Block, the Samopomich party, the Opposition block, the Radical Party, and the AUU Batkivshchyna.
Table 3 — Votes given for leading parties at penitentiary and other polling stations nationwide
|
free, number of votes |
penitentiary, number of votes |
free, percentage of votes |
penitentiary, percentage of votes |
|
|
Total number of voters in the list |
30,581,565 |
72,729 |
||
|
Total number of votes "for" |
15,364,421 |
64,513 |
||
|
The People's Front |
3,402,654 |
12,495 |
22.1463 |
19.3682 |
|
The Petro Poroshenko Block |
3,320,780 |
25,000 |
21.6134 |
38.7519 |
|
The Samopomich Union |
1,697,225 |
1,954 |
11.0465 |
3.0288 |
|
The Opposition Block |
1,460,324 |
1,608 |
9.5046 |
2.4925 |
|
The Radical Party |
1,148,247 |
4,395 |
7.4734 |
6.8126 |
|
The AUU Batkivshchyna |
868,512 |
8,168 |
5.6527 |
12.661 |
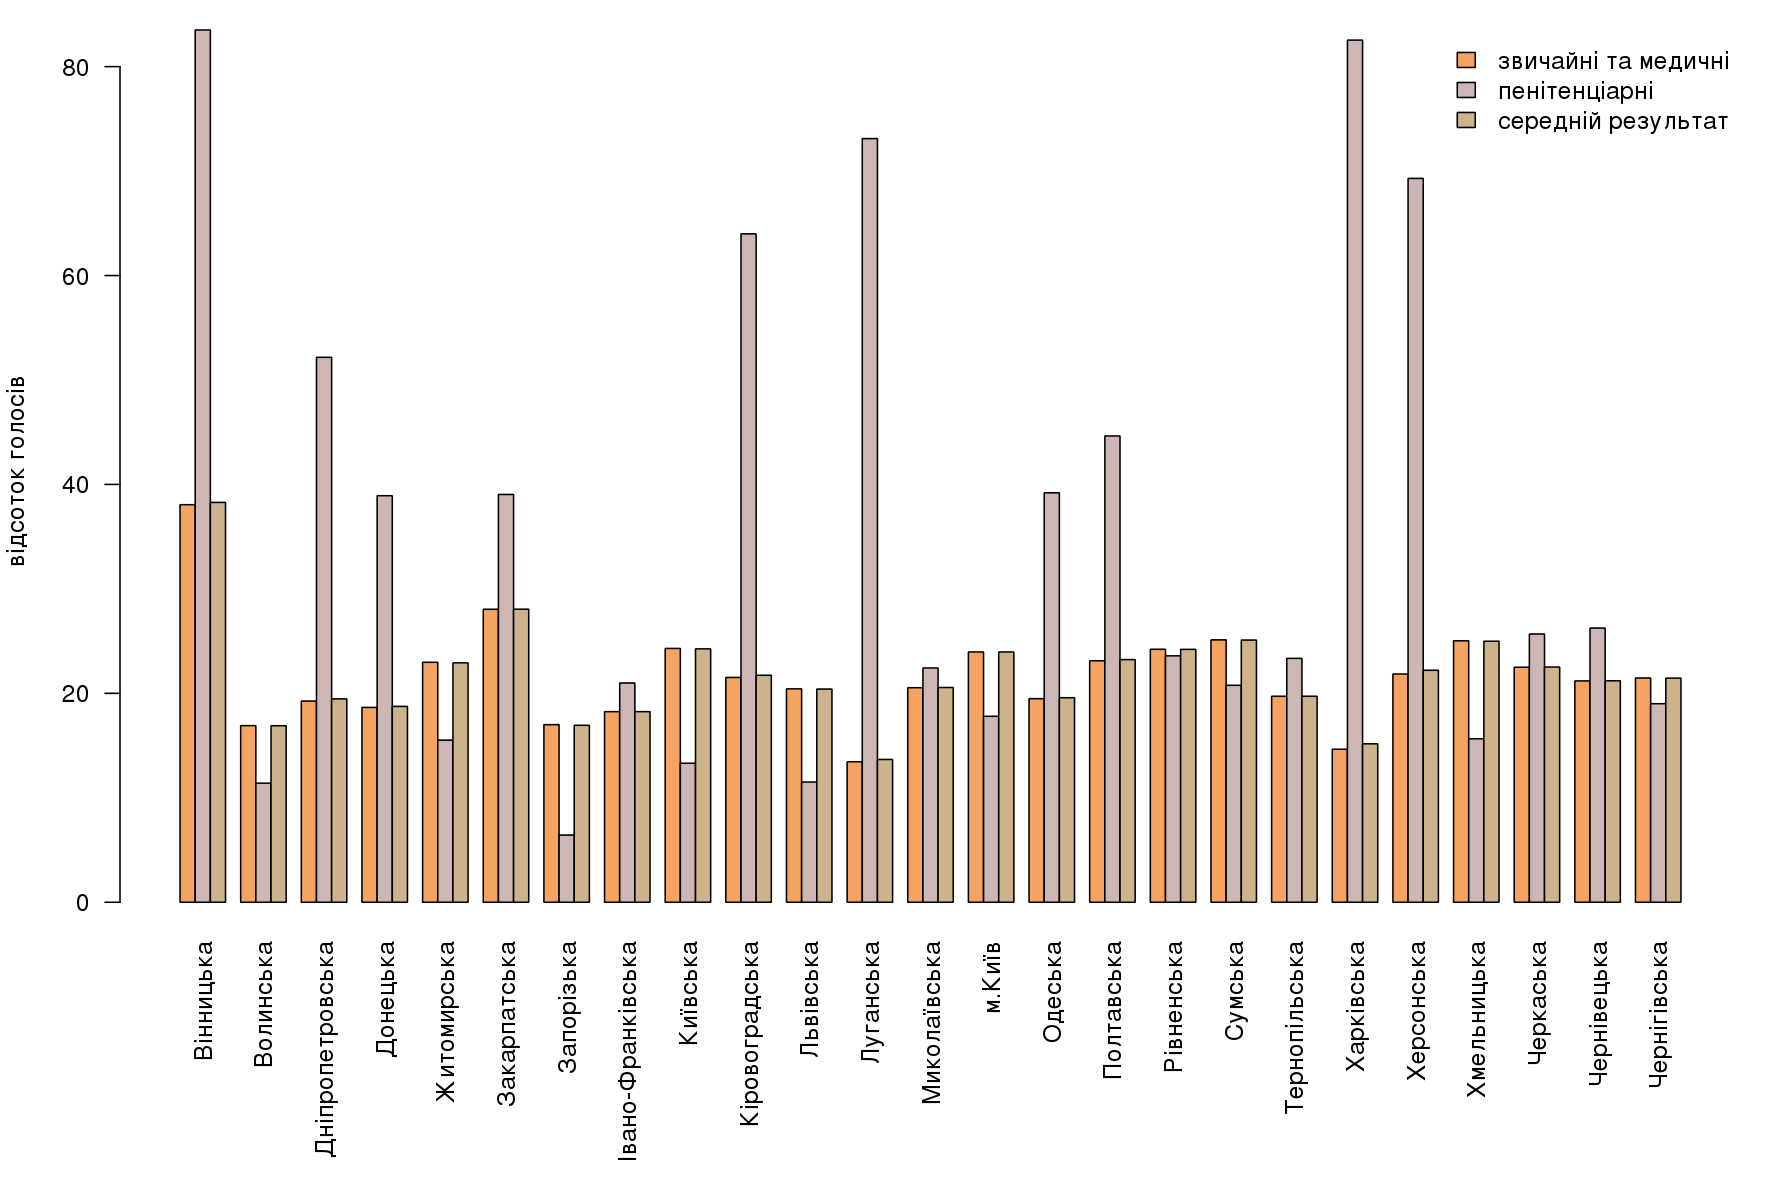
Calculation of votes given for abovementioned parties at different polling stations in Ukrainian oblasts and the city of Kyiv will show us the situation in detail. Results of such calculation are available in the Table 4.
As we can see, voting results at different types of polling stations vary in the certain oblasts. It's also obvious that the Petro Poroshenko Block has exceedingly high support at penitentiary polls. Vinnytsia, Kharkiv, Luhansk, and Kirovograd oblasts have the largest discrepancy. The number of votes given for the Petro Poroshenko Block in penitentiary institutions in these oblasts is way bigger than in the whole region in total! Voting results are so unreal that we can suggest that the compulsion and administrative resources were widely used. To illustrate the difference between results of the "free" and "imprisoned" voting, we created a diagram. The diagram displays results of the "free" and "imprisoned", and "oblast total" voting for the Petro Poroshenko Block.
Table 1 — Total number of votes given for the Petro Poroshenko Block at different types of polling stations
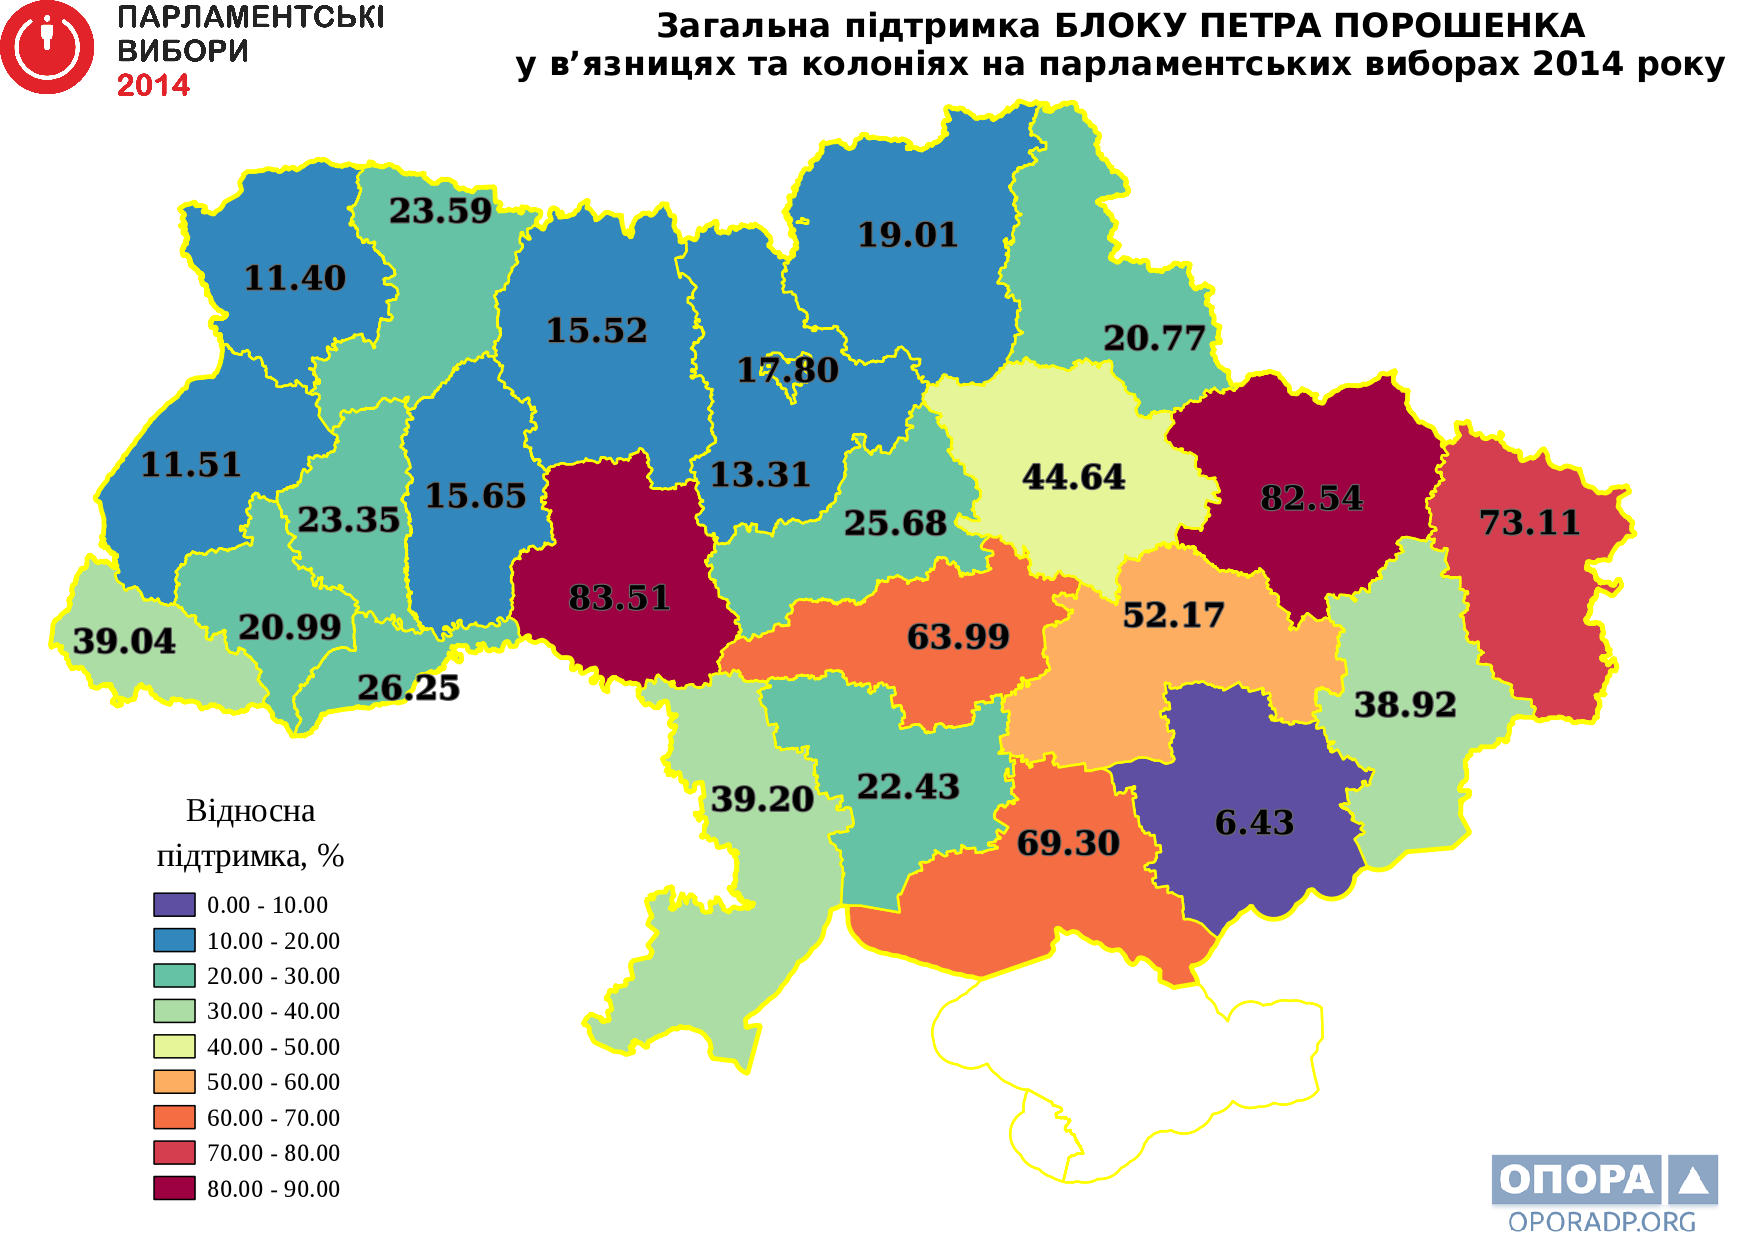
However, the cartogram displaying the total number of votes given for the Petro Poroshenko Block in penitentiary institutions.
Table 2 — Total number of votes given for the Petro Poroshenko Block in penitentiary institutions
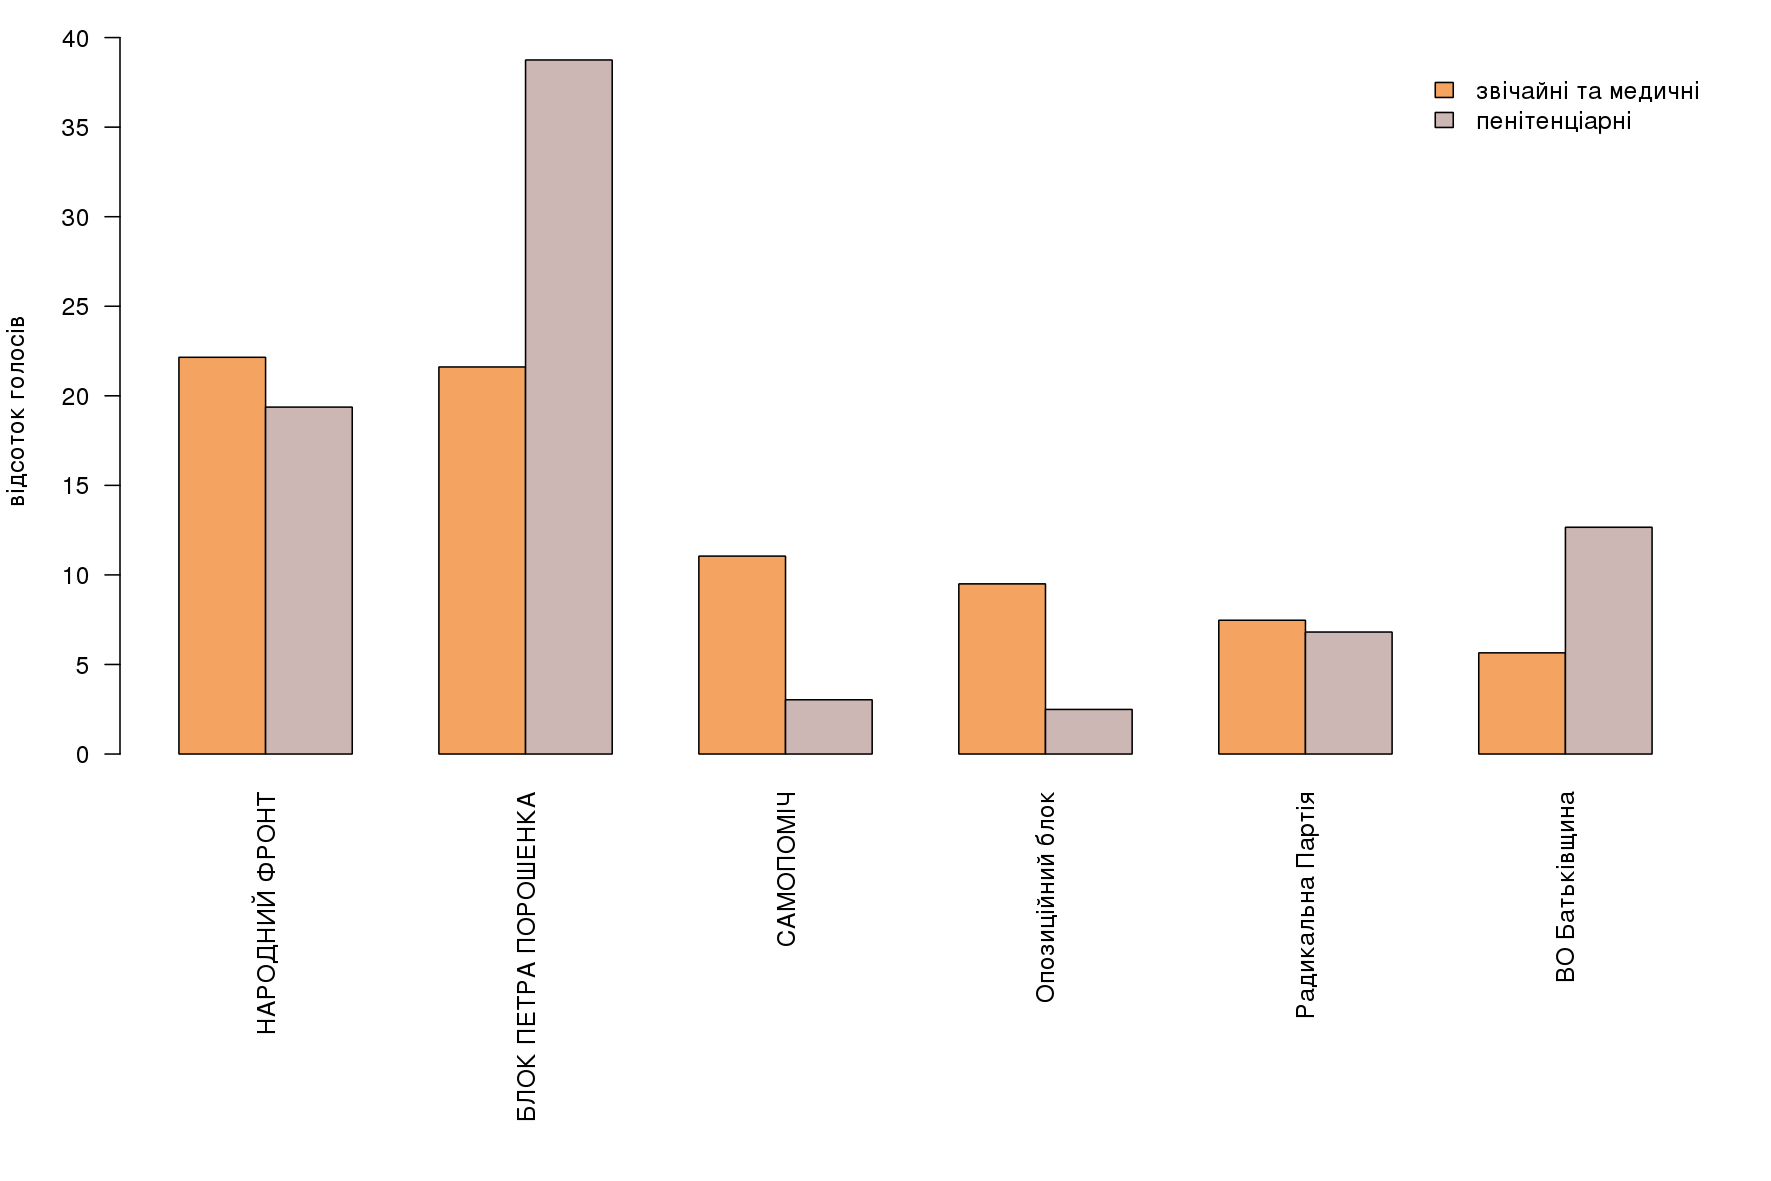
To make a detailed comparison, we created the diagram displaying the "free" and "imprisoned" voting for every leading party.
Table 3 — Total number of votes given for leading parties at different types of polling stations
Finally, we took quite large (more than 300 persons) polling stations in penitentiary institutions, where more than 70% of votes are given for the certain party. Results of such selection are available in the Table 5.
Table 5 — Polling stations in penitentiary institutions where one political party received abnormally high support
|
SMD |
Number of polling station |
Number of votes "for" |
The People's Front |
The Petro Poroshenko Block |
The Samopomich Union |
The Opposition Block |
The Radical Party |
The AUU Batkivshchyna |
Maximal number of votes |
Minimal number of votes, % |
|
11 |
050192 |
659 |
8 |
542 |
5 |
3 |
15 |
41 |
542 |
82.25 |
|
12 |
000001 |
395 |
10 |
333 |
6 |
3 |
11 |
15 |
333 |
84.30 |
|
12 |
051589 |
397 |
10 |
304 |
17 |
4 |
1 |
22 |
304 |
76.57 |
|
12 |
051590 |
463 |
7 |
371 |
2 |
4 |
15 |
26 |
371 |
80.13 |
|
14 |
050670 |
351 |
7 |
291 |
3 |
2 |
4 |
8 |
291 |
82.91 |
|
17 |
051637 |
489 |
1 |
459 |
10 |
1 |
0 |
11 |
459 |
93.87 |
|
39 |
120522 |
856 |
15 |
746 |
8 |
5 |
7 |
27 |
746 |
87.15 |
|
40 |
121045 |
379 |
3 |
320 |
3 |
3 |
22 |
9 |
320 |
84.43 |
|
78 |
230691 |
334 |
242 |
14 |
1 |
3 |
9 |
14 |
242 |
72.46 |
|
113 |
000001 |
476 |
5 |
348 |
1 |
26 |
23 |
8 |
348 |
73.11 |
|
144 |
531211 |
708 |
30 |
533 |
7 |
7 |
28 |
39 |
533 |
75.28 |
|
145 |
530778 |
413 |
39 |
304 |
10 |
1 |
15 |
12 |
304 |
73.61 |
|
168 |
631176 |
964 |
7 |
854 |
1 |
3 |
3 |
63 |
854 |
88.59 |
|
172 |
631590 |
805 |
4 |
747 |
0 |
1 |
6 |
28 |
747 |
92.80 |
|
173 |
631375 |
586 |
9 |
510 |
3 |
4 |
10 |
25 |
510 |
87.03 |
|
173 |
631688 |
904 |
1 |
870 |
1 |
7 |
2 |
5 |
870 |
96.24 |
|
174 |
631230 |
738 |
4 |
667 |
3 |
3 |
6 |
22 |
667 |
90.38 |
|
178 |
630059 |
421 |
2 |
383 |
3 |
6 |
5 |
10 |
383 |
90.97 |
|
178 |
631071 |
280 |
2 |
239 |
0 |
1 |
9 |
10 |
239 |
85.36 |
|
181 |
630882 |
900 |
1 |
843 |
2 |
1 |
1 |
20 |
843 |
93.67 |
|
182 |
650781 |
306 |
8 |
227 |
3 |
1 |
14 |
29 |
227 |
74.18 |
|
183 |
650086 |
814 |
11 |
587 |
13 |
26 |
39 |
29 |
587 |
72.11 |
|
183 |
650087 |
332 |
12 |
252 |
1 |
6 |
12 |
11 |
252 |
75.90 |
|
187 |
000001 |
283 |
199 |
7 |
13 |
3 |
11 |
30 |
199 |
70.32 |
As we can see, the Petro Poroshenko Block usually receives abnormally high support at relatively large polls in penitentiary institutions. Only two polling stations gave all the votes to the People's Front party.
The data used for calculations given above is not complete. However, even if the data was complete, correlation of votes in the results of our research wouldn't change. Unfortunately, we suspect that the results of voting in penitentiary institutions have immensely affected the results of free voting.